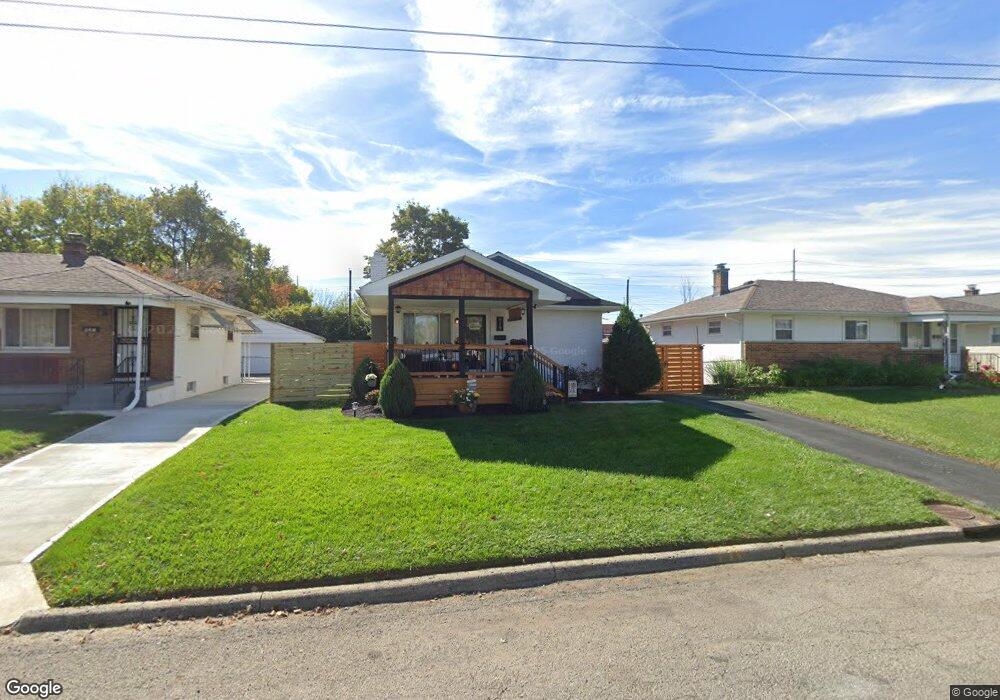
919 Reeb Ave Columbus, OH 43207
Edgewood NeighborhoodEstimated Value: $139,000 - $196,000
3
Beds
2
Baths
864
Sq Ft
$206/Sq Ft
Est. Value
About This Home
This home is located at 919 Reeb Ave, Columbus, OH 43207 and is currently estimated at $178,252, approximately $206 per square foot. 919 Reeb Ave is a home located in Franklin County with nearby schools including Moler Elementary School, South High School, and Summit Academy Community School-Columbus.
Ownership History
Date
Name
Owned For
Owner Type
Purchase Details
Closed on
Nov 24, 2020
Sold by
614 Homes Llc
Bought by
Davis Ben and Davis Michelle M
Current Estimated Value
Home Financials for this Owner
Home Financials are based on the most recent Mortgage that was taken out on this home.
Original Mortgage
$124,000
Outstanding Balance
$109,584
Interest Rate
2.8%
Mortgage Type
New Conventional
Estimated Equity
$68,668
Purchase Details
Closed on
Jun 22, 2020
Sold by
Es Tayla and Es Sokhom
Bought by
614 Homes Llc
Home Financials for this Owner
Home Financials are based on the most recent Mortgage that was taken out on this home.
Original Mortgage
$44,933
Interest Rate
3.2%
Mortgage Type
Unknown
Purchase Details
Closed on
Oct 9, 2013
Sold by
Es Sarun
Bought by
Es Tayla and Es Sokhom
Purchase Details
Closed on
Mar 24, 1987
Bought by
Es Heath and Sarun Long
Create a Home Valuation Report for This Property
The Home Valuation Report is an in-depth analysis detailing your home's value as well as a comparison with similar homes in the area
Home Values in the Area
Average Home Value in this Area
Purchase History
| Date | Buyer | Sale Price | Title Company |
|---|---|---|---|
| Davis Ben | $155,000 | Search 2 Close | |
| 614 Homes Llc | $45,000 | Search 2 Close | |
| Es Tayla | -- | None Available | |
| Es Heath | $37,000 | -- |
Source: Public Records
Mortgage History
| Date | Status | Borrower | Loan Amount |
|---|---|---|---|
| Open | Davis Ben | $124,000 | |
| Previous Owner | 614 Homes Llc | $44,933 |
Source: Public Records
Tax History
| Year | Tax Paid | Tax Assessment Tax Assessment Total Assessment is a certain percentage of the fair market value that is determined by local assessors to be the total taxable value of land and additions on the property. | Land | Improvement |
|---|---|---|---|---|
| 2025 | $2,983 | $66,470 | $15,260 | $51,210 |
| 2024 | $2,983 | $66,470 | $15,260 | $51,210 |
| 2023 | $2,945 | $66,465 | $15,260 | $51,205 |
| 2022 | $2,473 | $47,680 | $5,780 | $41,900 |
| 2021 | $2,501 | $47,680 | $5,780 | $41,900 |
| 2020 | $1,065 | $20,480 | $5,780 | $14,700 |
| 2019 | $1,024 | $16,880 | $4,800 | $12,080 |
| 2018 | $1,028 | $16,880 | $4,800 | $12,080 |
| 2017 | $1,081 | $16,880 | $4,800 | $12,080 |
| 2016 | $1,139 | $17,190 | $5,040 | $12,150 |
| 2015 | $1,034 | $17,190 | $5,040 | $12,150 |
| 2014 | $1,036 | $17,190 | $5,040 | $12,150 |
| 2013 | $538 | $18,095 | $5,320 | $12,775 |
Source: Public Records
Map
Nearby Homes
- 990 Reeb Ave
- 941 Lawrence Dr Unit 943
- 1019 Lawrence Dr
- 1099 Lawrence Dr
- 1784 S Champion Ave
- 1723 S Champion Ave
- 1739 Linwood Ave
- 69 E Woodrow Ave
- 1777 Lockbourne Rd
- 782 Stambaugh Ave
- 1172 E Woodrow Ave
- 1575 S Champion Ave
- 1568 Oakwood Ave
- 868 Lawndale Ave
- 818 Lawndale Ave
- 1571 Wilson Ave
- 546 Stambaugh Ave
- 2441 Wilson Ave
- 1718 Weiler Ave
- 1657 Ann St
Your Personal Tour Guide
Ask me questions while you tour the home.