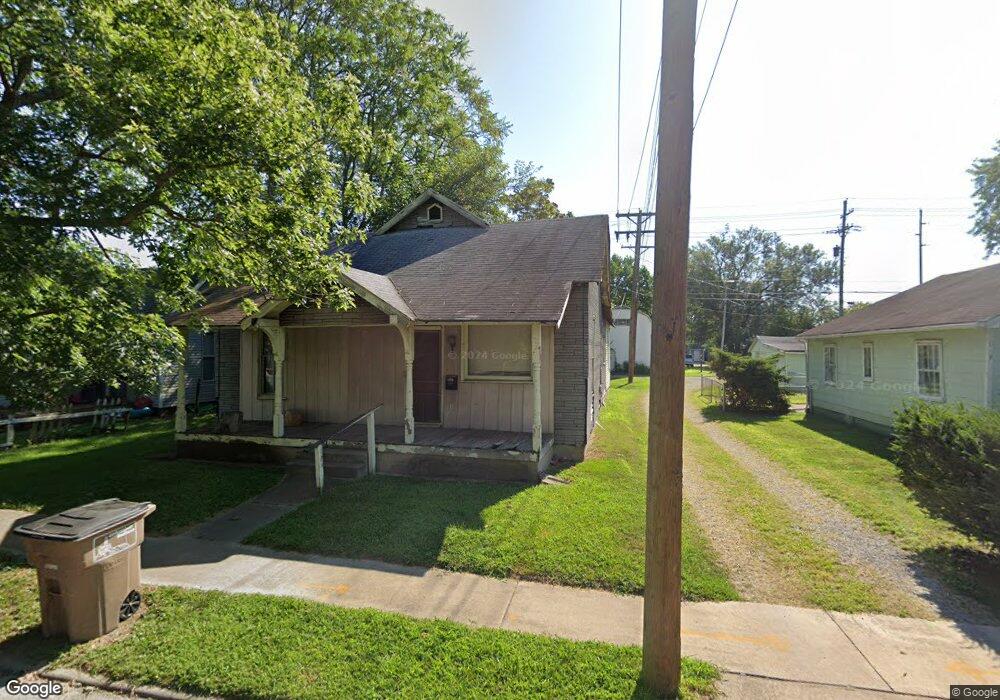
919 Union St Columbus, IN 47201
Estimated Value: $161,000 - $194,000
4
Beds
1
Bath
1,680
Sq Ft
$104/Sq Ft
Est. Value
About This Home
This home is located at 919 Union St, Columbus, IN 47201 and is currently estimated at $175,288, approximately $104 per square foot. 919 Union St is a home located in Bartholomew County with nearby schools including Lillian Schmitt Elementary School, Central Middle School, and Columbus North High School.
Ownership History
Date
Name
Owned For
Owner Type
Purchase Details
Closed on
Sep 7, 2016
Sold by
Burton Julie G
Bought by
Mccord Sean M and Burton Julie G
Current Estimated Value
Purchase Details
Closed on
Apr 22, 2008
Sold by
Mccord Sean
Bought by
Burton Julie G
Purchase Details
Closed on
Sep 28, 2007
Sold by
Desrosiers Paul
Bought by
Mccord Sean
Purchase Details
Closed on
Apr 10, 2007
Sold by
Sheriff Of Bartholomew County and Dougherty Margaret
Bought by
Home Federal Savings Bank
Create a Home Valuation Report for This Property
The Home Valuation Report is an in-depth analysis detailing your home's value as well as a comparison with similar homes in the area
Home Values in the Area
Average Home Value in this Area
Purchase History
| Date | Buyer | Sale Price | Title Company |
|---|---|---|---|
| Mccord Sean M | -- | None Available | |
| Burton Julie G | -- | Attorney | |
| Mccord Sean | -- | None Available | |
| Desrosiers Paul | -- | None Available | |
| Home Federal Savings Bank | -- | None Available |
Source: Public Records
Tax History
| Year | Tax Paid | Tax Assessment Tax Assessment Total Assessment is a certain percentage of the fair market value that is determined by local assessors to be the total taxable value of land and additions on the property. | Land | Improvement |
|---|---|---|---|---|
| 2025 | $546 | $120,400 | $46,100 | $74,300 |
| 2024 | $401 | $122,300 | $46,100 | $76,200 |
| 2023 | $401 | $115,100 | $46,100 | $69,000 |
| 2022 | $524 | $114,400 | $46,100 | $68,300 |
| 2021 | $9 | $83,900 | $16,700 | $67,200 |
| 2020 | $0 | $59,500 | $16,700 | $42,800 |
| 2019 | $394 | $56,000 | $16,700 | $39,300 |
| 2018 | $0 | $54,200 | $16,700 | $37,500 |
| 2017 | $219 | $53,100 | $17,400 | $35,700 |
| 2016 | $345 | $53,100 | $17,400 | $35,700 |
| 2014 | $348 | $52,200 | $17,400 | $34,800 |
Source: Public Records
Map
Nearby Homes
Your Personal Tour Guide
Ask me questions while you tour the home.