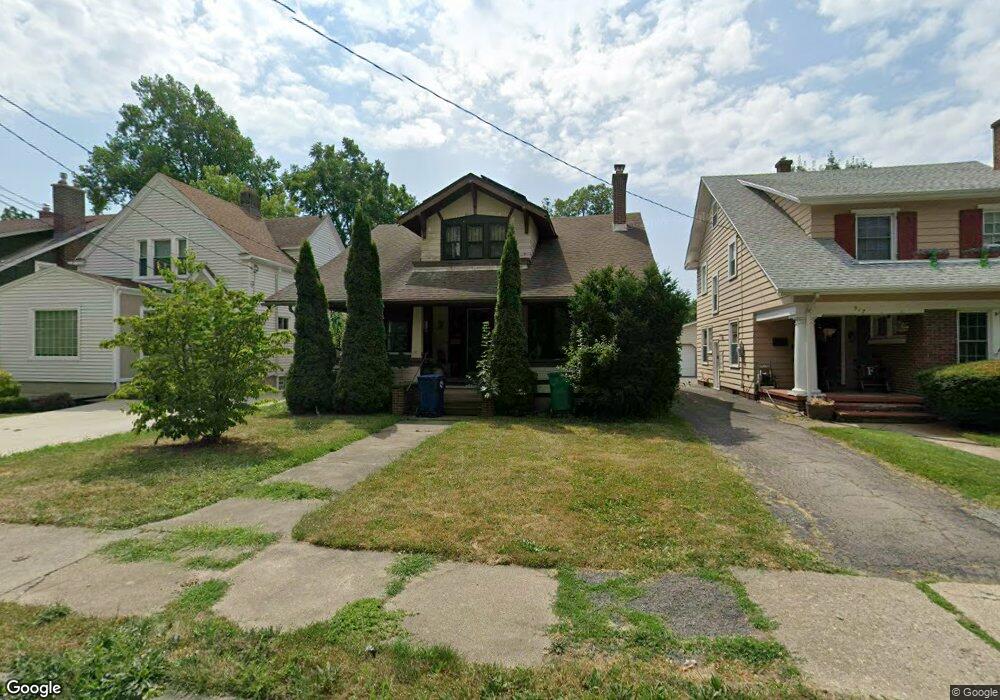
919 Vanderbilt Ave Niagara Falls, NY 14305
North End NeighborhoodEstimated Value: $177,000 - $210,303
3
Beds
2
Baths
1,512
Sq Ft
$126/Sq Ft
Est. Value
About This Home
This home is located at 919 Vanderbilt Ave, Niagara Falls, NY 14305 and is currently estimated at $190,076, approximately $125 per square foot. 919 Vanderbilt Ave is a home located in Niagara County with nearby schools including Niagara Falls High School and St. Joseph Elementary School.
Ownership History
Date
Name
Owned For
Owner Type
Purchase Details
Closed on
Nov 30, 2011
Sold by
Rowcroft Jon J
Bought by
Gawel Michael W
Current Estimated Value
Home Financials for this Owner
Home Financials are based on the most recent Mortgage that was taken out on this home.
Original Mortgage
$67,152
Outstanding Balance
$46,788
Interest Rate
4.4%
Mortgage Type
FHA
Estimated Equity
$143,288
Purchase Details
Closed on
Apr 15, 2005
Sold by
Federal Home Loan Mortgage Corporation
Bought by
Rowcroft Jon
Purchase Details
Closed on
Feb 16, 2005
Sold by
Burns James R and Burns Gail P
Bought by
Federal Home Loan Mortgage Corporation
Purchase Details
Closed on
Nov 4, 1999
Purchase Details
Closed on
Jan 9, 1997
Purchase Details
Closed on
Oct 13, 1995
Sold by
Burns James R
Bought by
Burns James R and Quednau Laurie K
Purchase Details
Closed on
Apr 12, 1995
Sold by
Rowcroft Rosemary T
Bought by
Burns James R
Create a Home Valuation Report for This Property
The Home Valuation Report is an in-depth analysis detailing your home's value as well as a comparison with similar homes in the area
Home Values in the Area
Average Home Value in this Area
Purchase History
| Date | Buyer | Sale Price | Title Company |
|---|---|---|---|
| Gawel Michael W | $68,900 | Multiple | |
| Rowcroft Jon | $35,500 | Mathew Webber | |
| Federal Home Loan Mortgage Corporation | $63,562 | Steven Baum | |
| -- | -- | -- | |
| -- | -- | -- | |
| Burns James R | -- | -- | |
| Burns James R | $53,900 | -- |
Source: Public Records
Mortgage History
| Date | Status | Borrower | Loan Amount |
|---|---|---|---|
| Open | Gawel Michael W | $67,152 |
Source: Public Records
Tax History Compared to Growth
Tax History
| Year | Tax Paid | Tax Assessment Tax Assessment Total Assessment is a certain percentage of the fair market value that is determined by local assessors to be the total taxable value of land and additions on the property. | Land | Improvement |
|---|---|---|---|---|
| 2024 | $4,444 | $68,900 | $7,100 | $61,800 |
| 2023 | $2,791 | $68,900 | $7,100 | $61,800 |
| 2022 | $1,622 | $68,900 | $7,100 | $61,800 |
| 2021 | $1,598 | $68,900 | $7,100 | $61,800 |
| 2020 | $1,123 | $68,900 | $7,100 | $61,800 |
| 2019 | $1,284 | $68,900 | $7,100 | $61,800 |
| 2018 | $1,508 | $68,900 | $7,100 | $61,800 |
| 2017 | $1,284 | $68,900 | $7,100 | $61,800 |
| 2016 | $1,680 | $68,900 | $7,100 | $61,800 |
| 2015 | -- | $68,900 | $7,100 | $61,800 |
| 2014 | -- | $68,900 | $7,100 | $61,800 |
Source: Public Records
Map
Nearby Homes
- 3934 MacKlem Ave
- 3924 Washington St
- 4006 Deveaux St
- 4022 Lewiston Rd
- 3742 McKoon Ave
- 3750 Deveaux St
- 4214 Washington St
- 815 James Ave
- 1315 Maple Ave
- 4026 Barton St
- 2960 McKoon Ave
- 3402 Highland Ave
- 2946 McKoon Ave
- 1314 Norwood Ave
- 2936 McKoon Ave
- 1339 Norwood Ave
- 731 Seymour Ave
- 2863 MacKlem Ave
- 4626 Patricia Dr
- 725 Monteagle St
- 921 Vanderbilt Ave
- 917 Vanderbilt Ave
- 923 Vanderbilt Ave
- 3927 Washington St
- 3925 Washington St
- 909 Vanderbilt Ave
- 3923 Washington St
- 3926 MacKlem Ave
- 3930 MacKlem Ave
- 3924 MacKlem Ave
- 920 College Ave
- 3921 Washington St
- 3920 MacKlem Ave
- 916 College Ave
- 924 College Ave
- 928 College Ave
- 910 Vanderbilt Ave
- 3914 MacKlem Ave
- 920 Vanderbilt Ave
- 926 Vanderbilt Ave