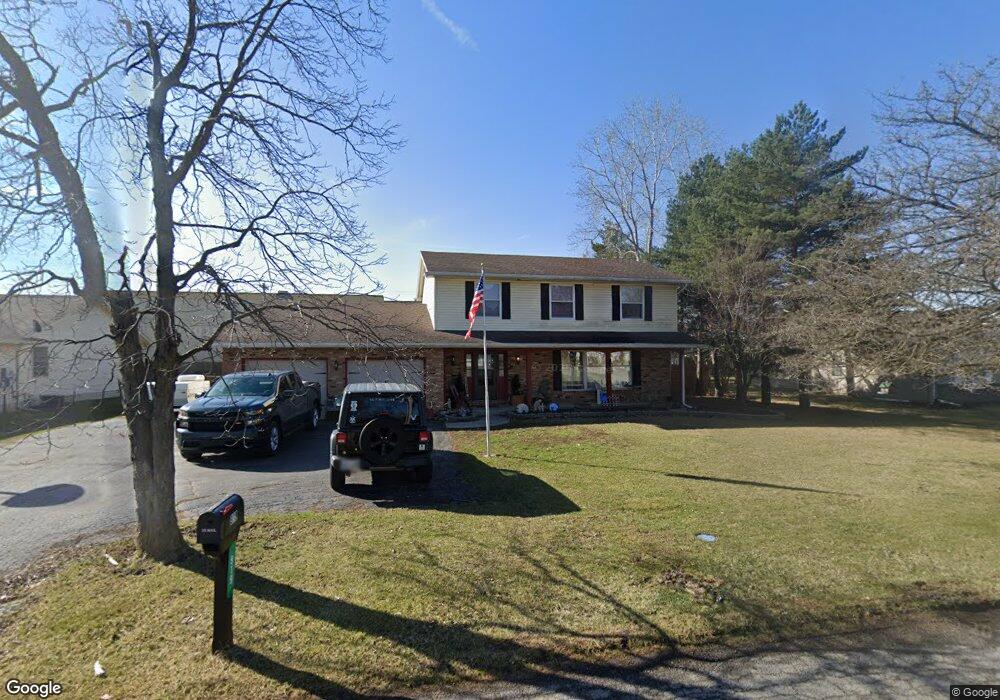
919 W Melrose Ave Findlay, OH 45840
Estimated Value: $308,000 - $334,000
4
Beds
3
Baths
2,148
Sq Ft
$151/Sq Ft
Est. Value
About This Home
This home is located at 919 W Melrose Ave, Findlay, OH 45840 and is currently estimated at $325,333, approximately $151 per square foot. 919 W Melrose Ave is a home located in Hancock County with nearby schools including Bigelow Hill Elementary School, Northview Elementary School, and Glenwood Middle School.
Ownership History
Date
Name
Owned For
Owner Type
Purchase Details
Closed on
May 23, 2003
Sold by
Craig James E and Craig Carolyn A
Bought by
Estep Scott A and Estep Linda L
Current Estimated Value
Home Financials for this Owner
Home Financials are based on the most recent Mortgage that was taken out on this home.
Original Mortgage
$153,510
Outstanding Balance
$64,916
Interest Rate
5.9%
Mortgage Type
VA
Estimated Equity
$260,417
Purchase Details
Closed on
May 30, 1990
Bought by
Craig James E and Craig Carolyn A
Purchase Details
Closed on
Jul 21, 1987
Bought by
Craig James E and Craig Carolyn A
Purchase Details
Closed on
Jul 25, 1986
Bought by
Shields Bruce L and Shields Sherry J
Purchase Details
Closed on
Apr 1, 1985
Bought by
Hansen Jim L and Hansen Debra K
Purchase Details
Closed on
Dec 31, 1984
Bought by
Equitable Relocation and Davis Norma B
Create a Home Valuation Report for This Property
The Home Valuation Report is an in-depth analysis detailing your home's value as well as a comparison with similar homes in the area
Home Values in the Area
Average Home Value in this Area
Purchase History
We collect this data history from publicly available records. To have your information removed, we recommend requesting removal directly through your county’s website.
| Date | Buyer | Sale Price | Title Company |
|---|---|---|---|
| Estep Scott A | $150,500 | Golden Key | |
| Craig James E | -- | -- | |
| Craig James E | $110,500 | -- | |
| Shields Bruce L | $98,500 | -- | |
| Hansen Jim L | $89,000 | -- | |
| Equitable Relocation | -- | -- |
Source: Public Records
Mortgage History
We collect this data history from publicly available records. To have your information removed, we recommend requesting removal directly through your county’s website.
| Date | Status | Borrower | Loan Amount |
|---|---|---|---|
| Open | Estep Scott A | $153,510 |
Source: Public Records
Tax History
| Year | Tax Paid | Tax Assessment Tax Assessment Total Assessment is a certain percentage of the fair market value that is determined by local assessors to be the total taxable value of land and additions on the property. | Land | Improvement |
|---|---|---|---|---|
| 2024 | $2,965 | $81,750 | $27,300 | $54,450 |
| 2023 | $2,969 | $81,750 | $27,300 | $54,450 |
| 2022 | $2,967 | $81,750 | $27,300 | $54,450 |
| 2021 | $2,619 | $62,940 | $20,830 | $42,110 |
| 2020 | $2,618 | $62,940 | $20,830 | $42,110 |
| 2019 | $2,753 | $62,940 | $20,830 | $42,110 |
| 2018 | $2,563 | $54,010 | $11,900 | $42,110 |
| 2017 | $1,174 | $54,010 | $11,900 | $42,110 |
| 2016 | $2,381 | $55,580 | $11,900 | $43,680 |
| 2015 | $2,888 | $66,050 | $11,900 | $54,150 |
| 2014 | $2,889 | $66,050 | $11,900 | $54,150 |
| 2012 | $2,908 | $66,050 | $11,900 | $54,150 |
Source: Public Records
Map
Nearby Homes
- 724 Edith Ave
- 2411 Villa West Dr
- 408 Edith Ave
- 410 Prentiss Ave
- 627 W Foulke Ave
- 10321 Wheatfield Dr
- 2419 Hollybrook Dr
- 2923 Gleneagle Dr
- 2418 Hollybrook Dr
- 2400 Hollybrook Dr
- 323 W Bigelow Ave
- 2215 Beecher St
- 1934 Geffs Ave
- 146 Clifton Ave
- 142 Clifton Ave
- 151 Monroe Ave
- 140 Monroe Ave
- 1409 Cypress Lake
- 1617 Bay Hill Dr
- 10036 Township Road 94
- 915 W Melrose Ave Unit 915
- 917 W Melrose Ave
- 909 W Melrose Ave
- 911 W Melrose Ave
- 933 W Melrose Ave
- 920 W Melrose Ave
- 914 W Melrose Ave
- 928 W Melrose Ave
- 901 W Melrose Ave
- 934 W Melrose Ave
- 2207 Westmoor Rd
- 2208 Westmoor Rd
- 835 W Melrose Ave
- 833 W Melrose Ave
- 940 W Melrose Ave
- 2213 Westmoor Rd
- 2209 Northridge Rd
- 2216 Westmoor Rd
- 2219 Westmoor Rd
- 823 W Melrose Ave
Your Personal Tour Guide
Ask me questions while you tour the home.