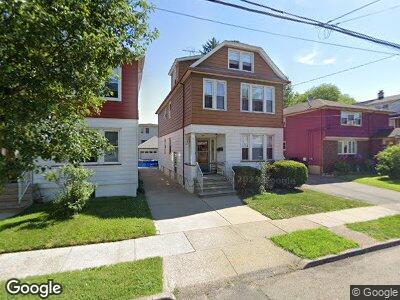
919 York St East Rutherford, NJ 07073
Estimated Value: $575,515 - $682,000
2
Beds
1
Bath
1,732
Sq Ft
$357/Sq Ft
Est. Value
About This Home
This home is located at 919 York St, East Rutherford, NJ 07073 and is currently estimated at $618,129, approximately $356 per square foot. 919 York St is a home located in Bergen County with nearby schools including Mckenzie School, Alfred Faust School, and Henry P Becton Regional High School.
Ownership History
Date
Name
Owned For
Owner Type
Purchase Details
Closed on
Jul 5, 2016
Sold by
Dul Tadeusz and Dul Teddy
Bought by
Dul Danuta
Current Estimated Value
Purchase Details
Closed on
Mar 25, 1999
Sold by
Switek Robert
Bought by
Dul Tadeusz and Dul Danuta
Home Financials for this Owner
Home Financials are based on the most recent Mortgage that was taken out on this home.
Original Mortgage
$60,000
Interest Rate
6.78%
Mortgage Type
Stand Alone First
Purchase Details
Closed on
Oct 1, 1998
Sold by
Switek Bernice
Bought by
Switek Robert
Create a Home Valuation Report for This Property
The Home Valuation Report is an in-depth analysis detailing your home's value as well as a comparison with similar homes in the area
Home Values in the Area
Average Home Value in this Area
Purchase History
| Date | Buyer | Sale Price | Title Company |
|---|---|---|---|
| Dul Danuta | -- | None Available | |
| Dul Tadeusz | $192,000 | -- | |
| Switek Robert | $70,000 | -- |
Source: Public Records
Mortgage History
| Date | Status | Borrower | Loan Amount |
|---|---|---|---|
| Closed | Dul Tadeusz | $60,000 |
Source: Public Records
Tax History Compared to Growth
Tax History
| Year | Tax Paid | Tax Assessment Tax Assessment Total Assessment is a certain percentage of the fair market value that is determined by local assessors to be the total taxable value of land and additions on the property. | Land | Improvement |
|---|---|---|---|---|
| 2024 | $7,359 | $472,100 | $272,600 | $199,500 |
| 2023 | $7,247 | $453,400 | $260,400 | $193,000 |
| 2022 | $7,247 | $413,900 | $238,600 | $175,300 |
| 2021 | $6,911 | $384,600 | $214,400 | $170,200 |
| 2020 | $6,767 | $372,000 | $209,500 | $162,500 |
| 2019 | $6,846 | $373,700 | $206,000 | $167,700 |
| 2018 | $5,876 | $330,500 | $175,700 | $154,800 |
| 2017 | $6,010 | $289,800 | $156,000 | $133,800 |
| 2016 | $5,637 | $289,800 | $156,000 | $133,800 |
| 2015 | $5,700 | $289,800 | $156,000 | $133,800 |
| 2014 | $5,518 | $289,800 | $156,000 | $133,800 |
Source: Public Records
Map
Nearby Homes