NOT LISTED FOR SALE

9193 Austin Bottom Rd Baxter, TN 38544

Estimated Value: $268,000 - $390,000

4 Beds
3 Baths
1,890 Sq Ft
$174/Sq Ft Est. Value

Last Sold October 22, 2020

Last sale price $225,000 $119 Per Sq Ft

Est. 46% increase in value since last sale

Current estimated payment $1,846/month

About This Home

As of October 2020

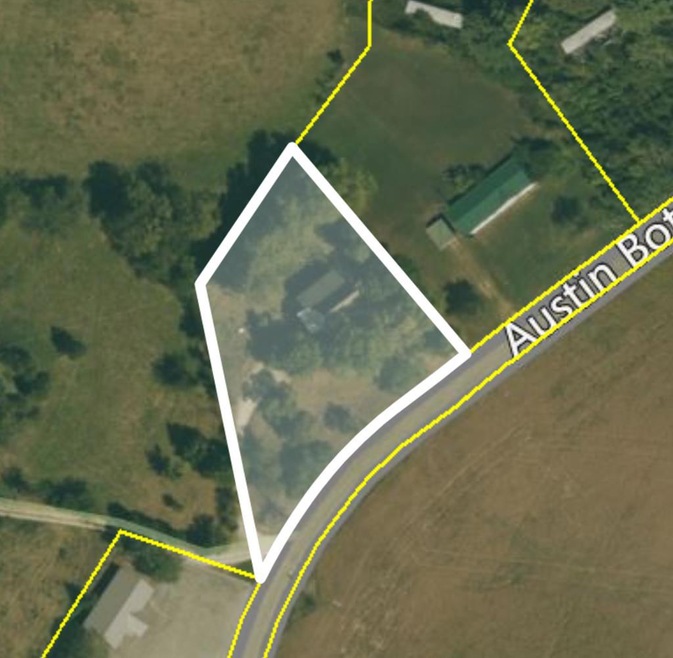
This home is located at 9193 Austin Bottom Rd, Baxter, TN 38544 since 22 October 2020 and is currently estimated at $329,382, approximately $174 per square foot. This property was built in 1979. 9193 Austin Bottom Rd is a home located in Putnam County with nearby schools including Baxter Primary School, Cornerstone Elementary School, and Upperman Middle School.

Last Agent to Sell the Property

Jeremy Youngblood

Crye-Leike Brown Realty Elite Brokerage Phone: 9318377653 License #350243 Listed on: 10/22/2020

Crye-Leike Brown Realty Elite

Last Buyer's Agent

Jeremy Youngblood

Crye-Leike Brown Realty Elite Brokerage Phone: 9318377653 License #350243 Listed on: 10/22/2020

Crye-Leike Brown Realty Elite

Home Details

Home Type

  • Single Family

Est. Annual Taxes

  • $625

Year Built

  • Built in 1979

Lot Details

  • 0.94

Home Design

  • 1,890 Sq Ft Home

Bedrooms and Bathrooms

  • 4 Bedrooms
  • 3 Full Bathrooms

Community Details

  • No Home Owners Association

Listing and Financial Details

  • Assessor Parcel Number 029.03

Home Details

Home Type

Single Family

Est. Annual Taxes

$625

Year Built

Built in 1979

Lot Details

0

Listing Details

  • Attribution Contact: 9318377653
  • Directions: austin bottom rd house on right
  • Prop. Type: Residential
  • Year Built: 1979
  • Property Sub Type: Site Built
  • Lot Size: ir
  • Subdivision Name: None
  • Carport Y N: No
  • Garage Yn: No
  • Special Features: None

Interior Features

  • Full Bathrooms: 3
  • Total Bedrooms: 4
  • Living Area: 1890

Garage/Parking

  • Attached Garage: No
  • Parking Features: None

Utilities

  • Electric: public
  • Gas Company: na
  • Water Source: public

Condo/Co-op/Association

  • Association: No

Lot Info

  • Farm Land Area Units: Square Feet
  • Parcel #: 029.03
  • Irrigation Water Rights: No

Tax Info

  • Tax Annual Amount: 625.4
  • Tax Map Number: 116

Ownership History

Date Name Owned For Owner Type

Purchase Details

Listed on
Oct 22, 2020
Closed on
Oct 22, 2020
Sold by
Hawn James David and Hawn Roberta Marie
Bought by
Williams Cheryl J and Williams Mitchell A
Seller's Agent
Jeremy Youngblood
Crye-Leike Brown Realty Elite
Buyer's Agent
Jeremy Youngblood
Crye-Leike Brown Realty Elite
Sold Price
$225,000
Current Estimated Value
$329,382

Home Financials for this Owner

Home Financials are based on the most recent Mortgage that was taken out on this home.
Estimated Appreciation
$104,382
Avg. Annual Appreciation
7.65%
Original Mortgage
$213,750
Outstanding Balance
$188,901
Interest Rate
2.8%
Mortgage Type
New Conventional
Estimated Equity
$140,481

Purchase Details

Closed on
Jun 12, 2020
Sold by
Lowran Elizabeth I
Bought by
Hawn James and Hawn Roberta

Purchase Details

Closed on
Apr 22, 1976
Bought by
Brown Kenneth H and Brown Barbara G
Source: Public Records

Range of Values:

--
Value Increase
--
Percent Increase
--
Adjusted for Inflation
Collateral Analytics

Collateral Analytics Collateral Analytics AVMs (Automated Valuation Model) employ a number of statistical approaches combined with neighborhood-specific comparable selection guarantees the most up-to-date and precise valuations.

Not Available

Collateral Analytics does not have data for the current month. Please view the chart for historical values.

ICE

ICE Mortgage Technology ICE Mortgage Technology’s AVM (Automated Valuation Model) is a state-of-the-art online residential property valuation tool that provides a quick and accurate estimate of the value of almost any home in the U.S.

Not Available

ICE Mortgage Technology does not have data for the current month. Please view the chart for historical values.

First American

First American First American Data & Analytics’ next-generation AVM combines unrivaled data assets with a blended ensemble of valuation models to produce highly accurate, reliable valuations you can trust.

Not Available

First American does not have data for the current month. Please view the chart for historical values.

Quantarium

Quantarium Quantarium’s valuation service, repeatedly proven the industry’s most accurate and comprehensive, is supercharged with a self-learning and auto-tuning AI engine that continually becomes smarter and more accurate as it processes daily inputs from the industry’s leading RE data lake.

Not Available

Quantarium does not have data for the current month. Please view the chart for historical values.

Average Value
Not Available
List Price
Sold Price
Create a Home Valuation Report for This Property
The Home Valuation Report is an in-depth analysis detailing your home's value as well as a comparison with similar homes in the area

Home Values in the Area

Source: Public Records

Average Home Value in this Area


Source: Public Records

Purchase History

Date Buyer Sale Price Title Company
Williams Cheryl J $225,000 None Available
Hawn James $80,000 None Available
Brown Kenneth H -- --
Source: Public Records

Mortgage History

Date Status Borrower Loan Amount
Open Williams Cheryl J $213,750
Source: Public Records

Property History

Date Event Price List to Sale Price per Sq Ft
10/22/2020 10/22/20 Sold $225,000 0.0% $119 / Sq Ft
01/01/1970 01/01/70 Off Market $225,000 -- --
Source: Upper Cumberland Association of REALTORS®

Tax History Compared to Growth

Source: Public Records

Tax History

Year Tax Paid Tax Assessment Tax Assessment Total Assessment is a certain percentage of the fair market value that is determined by local assessors to be the total taxable value of land and additions on the property. Land Improvement
2025 $1,385 $52,075 $0 $0
2024 $1,385 $52,075 $3,850 $48,225
2023 $1,385 $52,075 $3,850 $48,225
2022 $1,287 $52,075 $3,850 $48,225
2021 $1,287 $52,075 $3,850 $48,225
2020 $625 $52,075 $3,850 $48,225
2019 $625 $21,375 $2,600 $18,775
2018 $584 $21,375 $2,600 $18,775
2017 $584 $21,375 $2,600 $18,775
2016 $584 $21,375 $2,600 $18,775
2015 $600 $21,375 $2,600 $18,775
2014 $577 $20,564 $0 $0
Source: Public Records

Agents Affiliated with this Home

  • Section Image
See All Agents

Map

Source: Upper Cumberland Association of REALTORS®

MLS Number: 201228

Upper Cumberland Association of REALTORS®

APN: 116-029.03