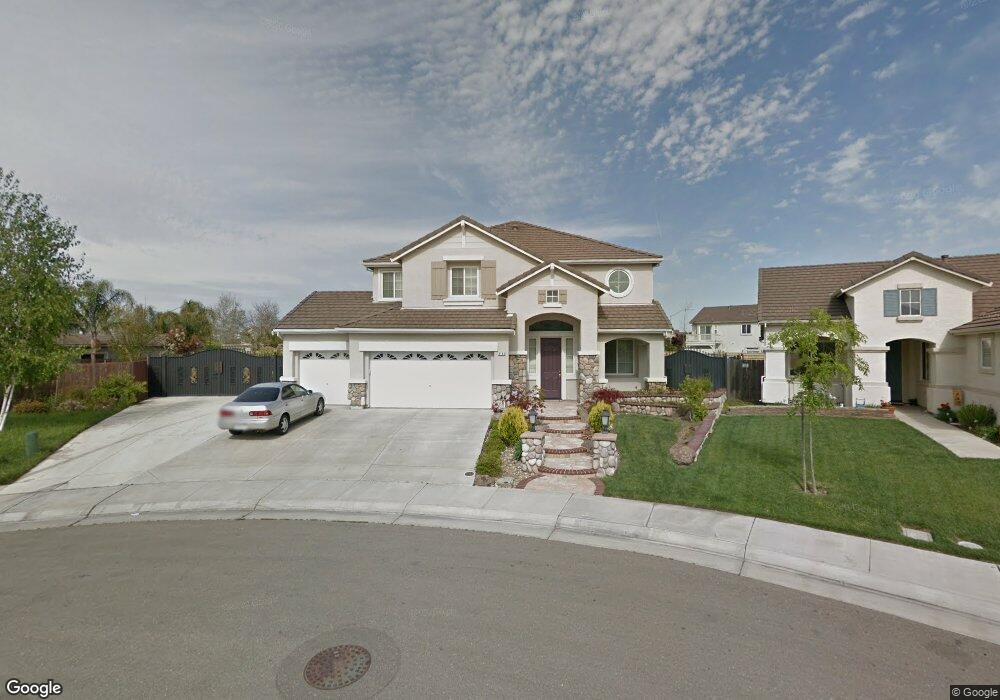
9193 Barbaresco Cir Stockton, CA 95212
Valley Oak NeighborhoodEstimated Value: $345,000 - $679,000
6
Beds
4
Baths
3,172
Sq Ft
$185/Sq Ft
Est. Value
About This Home
This home is located at 9193 Barbaresco Cir, Stockton, CA 95212 and is currently estimated at $586,766, approximately $184 per square foot. 9193 Barbaresco Cir is a home located in San Joaquin County with nearby schools including Ansel Adams School, Morada Middle School, and Ronald E. McNair High School.
Ownership History
Date
Name
Owned For
Owner Type
Purchase Details
Closed on
Mar 5, 2009
Sold by
Chandler Shawn
Bought by
Cham Ricky K and Phan Sodany
Current Estimated Value
Home Financials for this Owner
Home Financials are based on the most recent Mortgage that was taken out on this home.
Original Mortgage
$250,000
Outstanding Balance
$158,121
Interest Rate
5.03%
Mortgage Type
Purchase Money Mortgage
Estimated Equity
$428,645
Purchase Details
Closed on
Nov 5, 2008
Sold by
Uribe Felipe
Bought by
Chandler Shawn
Purchase Details
Closed on
Jul 8, 2005
Sold by
Stockton Villa Tuscany Lp
Bought by
Uribe Felipe
Home Financials for this Owner
Home Financials are based on the most recent Mortgage that was taken out on this home.
Original Mortgage
$416,513
Interest Rate
5.55%
Mortgage Type
Stand Alone First
Create a Home Valuation Report for This Property
The Home Valuation Report is an in-depth analysis detailing your home's value as well as a comparison with similar homes in the area
Home Values in the Area
Average Home Value in this Area
Purchase History
| Date | Buyer | Sale Price | Title Company |
|---|---|---|---|
| Cham Ricky K | $312,500 | Old Republic Title Company | |
| Chandler Shawn | -- | Old Republic Title Company | |
| Chandler Shawn | $227,140 | None Available | |
| Uribe Felipe | $521,000 | Old Republic Title Co |
Source: Public Records
Mortgage History
| Date | Status | Borrower | Loan Amount |
|---|---|---|---|
| Open | Cham Ricky K | $250,000 | |
| Previous Owner | Uribe Felipe | $416,513 |
Source: Public Records
Tax History Compared to Growth
Tax History
| Year | Tax Paid | Tax Assessment Tax Assessment Total Assessment is a certain percentage of the fair market value that is determined by local assessors to be the total taxable value of land and additions on the property. | Land | Improvement |
|---|---|---|---|---|
| 2025 | $5,557 | $402,399 | $100,436 | $301,963 |
| 2024 | $5,462 | $394,510 | $98,467 | $296,043 |
| 2023 | $5,378 | $386,776 | $96,537 | $290,239 |
| 2022 | $5,261 | $379,194 | $94,645 | $284,549 |
| 2021 | $5,307 | $371,760 | $92,790 | $278,970 |
| 2020 | $5,293 | $367,949 | $91,839 | $276,110 |
| 2019 | $5,145 | $360,736 | $90,039 | $270,697 |
| 2018 | $5,059 | $353,664 | $88,274 | $265,390 |
| 2017 | $4,929 | $346,731 | $86,544 | $260,187 |
| 2016 | $4,634 | $339,935 | $84,848 | $255,087 |
| 2014 | $4,796 | $328,275 | $81,937 | $246,338 |
Source: Public Records
Map
Nearby Homes
- 9126 Verdicchio Ct
- 9042 Chianti Cir
- 9516 San Marco Ct
- 3484 Cathedral Cir
- 9308 Pioneer Cir
- 8517 Kenny Ct
- 4520 E Morada Ln
- 9253 Bridalveil Cir
- 9109 Valley Dr
- 9740 Palazzo Dr
- 9454 N Highway 99 Unit 9
- 8061 Shay Cir
- 9484 N Highway 99 Unit 44
- 8013 Shay Cir
- 3827 Vecchio Ln
- 4320 Christian Life Way
- 3709 Popolo Cir
- 3069 Nicoletta Ln
- 4817 E Morada Ln
- 9332 Kirkby Ln
- 9189 Barbaresco Cir
- 9195 Barbaresco Cir
- 9231 Mammath Peak Cir
- 9148 Chianti Cir
- 9239 Mammath Peak Cir
- 9146 Chianti Cir
- 9185 Barbaresco Cir
- 9197 Barbaresco Cir
- 9961 Barbaresco Cir
- 9150 Chianti Cir
- 9194 Barbaresco Cir
- 9247 Mammath Peak Cir
- 9223 Mammath Peak Cir
- 9248 Lembert Dome Cir
- 9181 Barbaresco Cir
- 9152 Chianti Cir
- 9254 Lembert Dome Cir
- 9144 Chianti Cir
- 9198 Barbaresco Cir
- 9255 Mammath Peak Cir