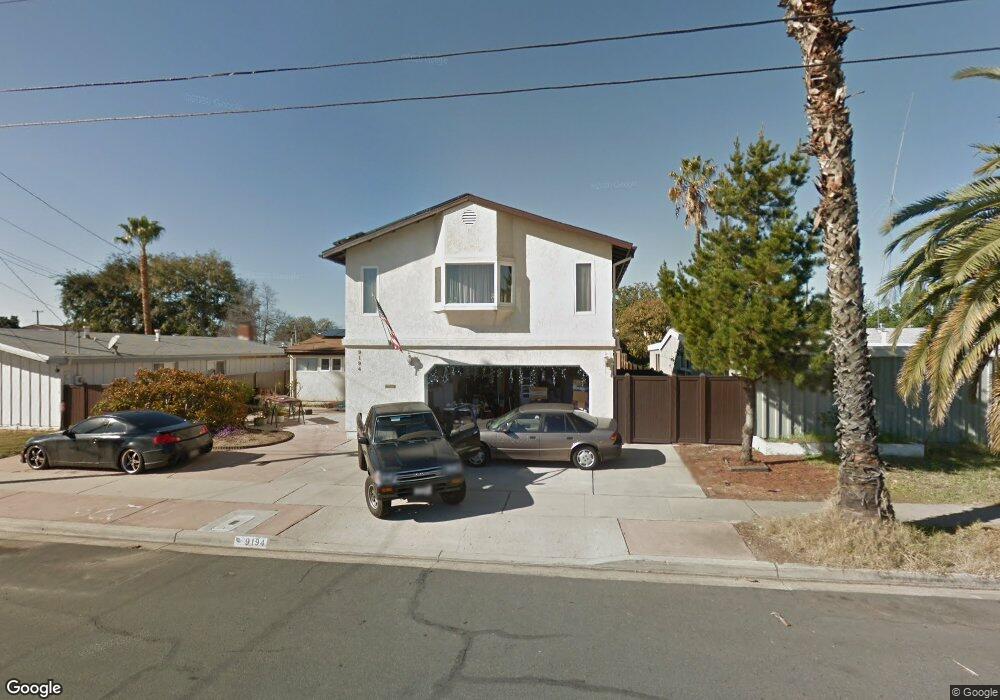
9194 Ronda Ave San Diego, CA 92123
Serra Mesa NeighborhoodEstimated Value: $1,019,000 - $1,187,000
4
Beds
3
Baths
2,013
Sq Ft
$552/Sq Ft
Est. Value
About This Home
This home is located at 9194 Ronda Ave, San Diego, CA 92123 and is currently estimated at $1,110,515, approximately $551 per square foot. 9194 Ronda Ave is a home located in San Diego County with nearby schools including Juarez Elementary School, Taft Middle School, and St. Columba Catholic School.
Ownership History
Date
Name
Owned For
Owner Type
Purchase Details
Closed on
Nov 13, 2003
Sold by
Cheatham James F
Bought by
Cheatham James F and Cheatham Carol J
Current Estimated Value
Purchase Details
Closed on
Jul 24, 2003
Sold by
Cheatham James Frank
Bought by
Cheatham James F
Home Financials for this Owner
Home Financials are based on the most recent Mortgage that was taken out on this home.
Original Mortgage
$255,000
Interest Rate
6.45%
Mortgage Type
Purchase Money Mortgage
Purchase Details
Closed on
Sep 3, 1993
Sold by
Shriver James E and Shriver Beverly Ann
Bought by
Cheatham James Frank
Home Financials for this Owner
Home Financials are based on the most recent Mortgage that was taken out on this home.
Original Mortgage
$158,100
Interest Rate
7.09%
Mortgage Type
VA
Purchase Details
Closed on
Aug 6, 1985
Create a Home Valuation Report for This Property
The Home Valuation Report is an in-depth analysis detailing your home's value as well as a comparison with similar homes in the area
Home Values in the Area
Average Home Value in this Area
Purchase History
| Date | Buyer | Sale Price | Title Company |
|---|---|---|---|
| Cheatham James F | -- | Commonwealth Land Title Co | |
| Cheatham James F | -- | -- | |
| Cheatham James Frank | $155,000 | California Coast Title | |
| -- | $106,600 | -- |
Source: Public Records
Mortgage History
| Date | Status | Borrower | Loan Amount |
|---|---|---|---|
| Previous Owner | Cheatham James F | $255,000 | |
| Previous Owner | Cheatham James Frank | $158,100 |
Source: Public Records
Tax History Compared to Growth
Tax History
| Year | Tax Paid | Tax Assessment Tax Assessment Total Assessment is a certain percentage of the fair market value that is determined by local assessors to be the total taxable value of land and additions on the property. | Land | Improvement |
|---|---|---|---|---|
| 2025 | $3,821 | $321,565 | $74,404 | $247,161 |
| 2024 | $3,821 | $315,261 | $72,946 | $242,315 |
| 2023 | $3,734 | $309,080 | $71,516 | $237,564 |
| 2022 | $3,634 | $303,020 | $70,114 | $232,906 |
| 2021 | $3,607 | $297,080 | $68,740 | $228,340 |
| 2020 | $3,563 | $294,035 | $68,036 | $225,999 |
| 2019 | $3,498 | $288,270 | $66,702 | $221,568 |
| 2018 | $3,270 | $282,619 | $65,395 | $217,224 |
| 2017 | $80 | $277,078 | $64,113 | $212,965 |
| 2016 | $3,137 | $271,646 | $62,856 | $208,790 |
| 2015 | $3,090 | $267,566 | $61,912 | $205,654 |
| 2014 | $3,041 | $262,326 | $60,700 | $201,626 |
Source: Public Records
Map
Nearby Homes
- 9212 Ronda Ave
- 2597 Melbourne Dr
- 2756 Bellezza Dr
- 2644 Mission Village Dr
- 2546 Marathon Dr
- 2642 Bellezza Dr
- 2765 Bellezza Dr
- 2753 Bellezza Dr
- 2770 Piantino Cir Unit 47
- 2772 Piantino Cir Unit 45
- 2673 Larkin Place
- 2750 Walker Dr
- 9452 Larrabee Ave
- 2806 Mission Village Dr
- 9208 Piantino Way Unit 127
- 9261 Fullerton Ave
- 2816 Villas Way
- 2932 Villas Way
- 9192 Fermi Ave
- 2640 Escala Cir
- 9182 Ronda Ave
- 9202 Ronda Ave
- 2503 Melbourne Dr
- 2493 Melbourne Dr
- 9174 Ronda Ave
- 2511 Melbourne Dr
- 2483 Melbourne Dr
- 9189 Ronda Ave
- 9197 Ronda Ave
- 2519 Melbourne Dr
- 9166 Ronda Ave
- 9220 Ronda Ave
- 9181 Ronda Ave
- 2473 Melbourne Dr
- 2527 Melbourne Dr
- 9215 Ronda Ave
- 2472 Eileen Dr
- 9158 Ronda Ave
- 9228 Ronda Ave
- 9173 Ronda Ave