Estimated Value: $472,000 - $522,000
4
Beds
2
Baths
1,044
Sq Ft
$468/Sq Ft
Est. Value
About This Home
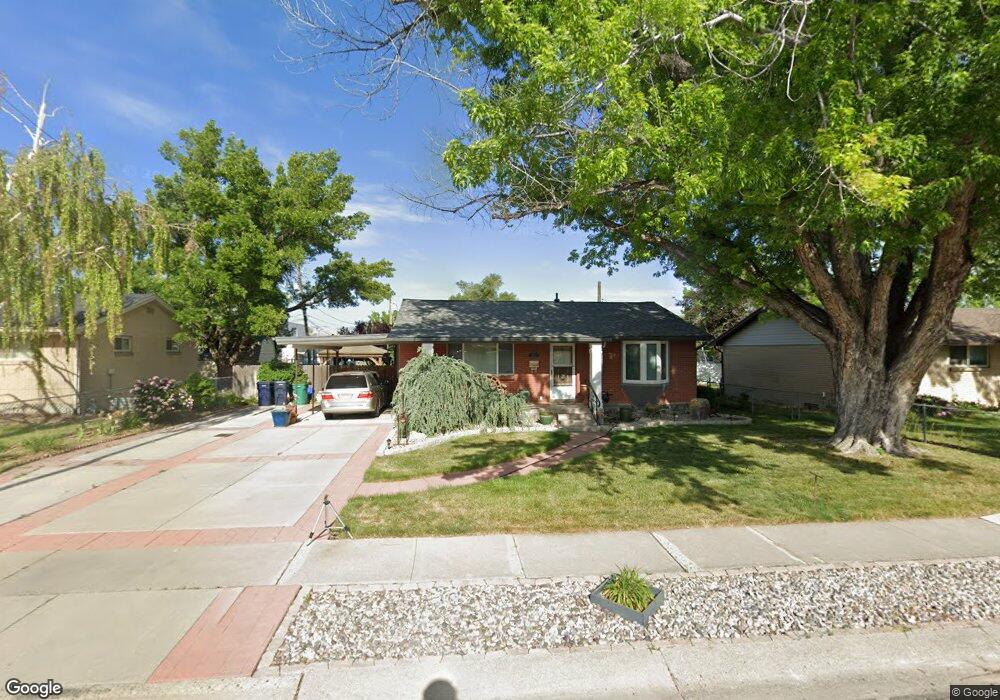
This home is located at 9198 S 260 E, Sandy, UT 84070 and is currently estimated at $488,759, approximately $468 per square foot. 9198 S 260 E is a home located in Salt Lake County with nearby schools including Sandy Elementary School, Mount Jordan Middle School, and Jordan High.
Ownership History
Date
Name
Owned For
Owner Type
Purchase Details
Closed on
Jul 14, 2021
Sold by
Bentley Nancy A
Bought by
Bentley Nancy A and Nancy A Bentley Living Trust
Current Estimated Value
Purchase Details
Closed on
Jul 28, 2017
Sold by
Bentley Nancy Ann
Bought by
Bentley Timothy Adam and Bentley Nancy Ann
Purchase Details
Closed on
Aug 18, 1998
Sold by
Bentley Joseph L and Bentley Nancy A
Bought by
Bentley Joseph L and Bentley Nancy A
Home Financials for this Owner
Home Financials are based on the most recent Mortgage that was taken out on this home.
Original Mortgage
$72,000
Outstanding Balance
$14,968
Interest Rate
6.88%
Estimated Equity
$473,791
Create a Home Valuation Report for This Property
The Home Valuation Report is an in-depth analysis detailing your home's value as well as a comparison with similar homes in the area
Home Values in the Area
Average Home Value in this Area
Purchase History
| Date | Buyer | Sale Price | Title Company |
|---|---|---|---|
| Bentley Nancy A | -- | None Available | |
| Bentley Timothy Adam | -- | None Available | |
| Bentley Joseph L | -- | -- |
Source: Public Records
Mortgage History
| Date | Status | Borrower | Loan Amount |
|---|---|---|---|
| Open | Bentley Joseph L | $72,000 |
Source: Public Records
Tax History
| Year | Tax Paid | Tax Assessment Tax Assessment Total Assessment is a certain percentage of the fair market value that is determined by local assessors to be the total taxable value of land and additions on the property. | Land | Improvement |
|---|---|---|---|---|
| 2025 | $2,660 | $496,400 | $140,200 | $356,200 |
| 2024 | $2,660 | $492,000 | $133,300 | $358,700 |
| 2023 | $2,571 | $474,000 | $126,700 | $347,300 |
| 2022 | $2,108 | $379,700 | $124,200 | $255,500 |
| 2021 | $1,967 | $301,700 | $96,100 | $205,600 |
| 2020 | $1,848 | $267,200 | $96,100 | $171,100 |
| 2019 | $1,770 | $249,400 | $90,700 | $158,700 |
| 2016 | $1,492 | $202,100 | $90,700 | $111,400 |
Source: Public Records
Map
Nearby Homes
- 362 E 9150 S
- 181 E 9180 S
- 487 E 9270 S
- 566 E 9270 S
- 186 Brent Cir
- 37 Crawford Place
- 8558 S Center St
- 112 E 8680 S
- 807 E Whisper Cove Rd
- 8732 S 620 E
- 9420 S Streatham Rd
- 9822 S Darin Dr
- 136 W Freedom Ave Unit 136
- 9218 S Laura Anne Way
- 9092 Enchanted Oak Ln
- 8750 S 500 E
- 8812 S Cy's Park Ln Unit 6
- 8807 S Cy's Park Ln E Unit 1
- 8806 S Cy's Park Ln E Unit 4
- 8808 S Cy's Park Unit 5
Your Personal Tour Guide
Ask me questions while you tour the home.