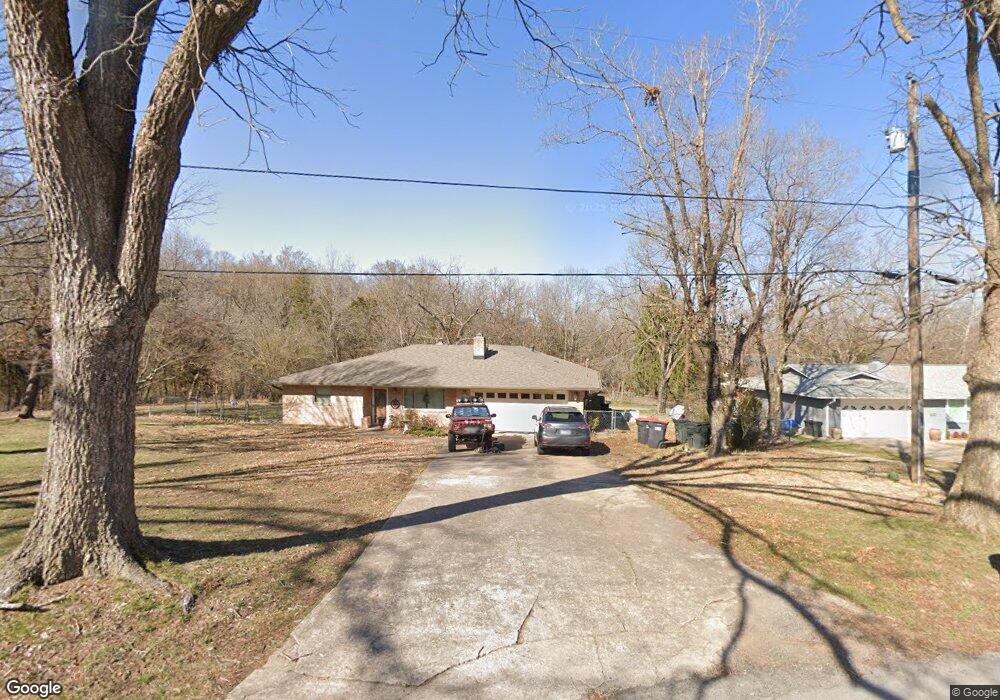
9199 Williams Rd Rogers, AR 72756
Estimated Value: $470,000 - $583,000
--
Bed
3
Baths
2,002
Sq Ft
$252/Sq Ft
Est. Value
About This Home
This home is located at 9199 Williams Rd, Rogers, AR 72756 and is currently estimated at $504,345, approximately $251 per square foot. 9199 Williams Rd is a home located in Benton County with nearby schools including Northside Elementary School, Lingle Middle School, and Rogers Heritage High School.
Ownership History
Date
Name
Owned For
Owner Type
Purchase Details
Closed on
Aug 1, 2013
Sold by
Cook Renee E and Livingston Emily Rose
Bought by
Parker Brian S and Parker Kharma K
Current Estimated Value
Purchase Details
Closed on
Dec 21, 2011
Bought by
Na
Purchase Details
Closed on
Dec 24, 2010
Bought by
Dod 12 and Dod 24
Purchase Details
Closed on
May 20, 2002
Bought by
Cook Tr W
Purchase Details
Closed on
Aug 23, 1996
Bought by
Cook Trusts
Purchase Details
Closed on
Apr 3, 1996
Bought by
Cook Tr
Purchase Details
Closed on
Mar 13, 1996
Bought by
Cook
Purchase Details
Closed on
Aug 30, 1994
Bought by
Cook
Purchase Details
Closed on
Nov 28, 1989
Bought by
Watson
Purchase Details
Closed on
Nov 20, 1989
Bought by
Dod 11-20-1989
Purchase Details
Closed on
Dec 15, 1983
Bought by
Hall
Create a Home Valuation Report for This Property
The Home Valuation Report is an in-depth analysis detailing your home's value as well as a comparison with similar homes in the area
Home Values in the Area
Average Home Value in this Area
Purchase History
| Date | Buyer | Sale Price | Title Company |
|---|---|---|---|
| Parker Brian S | $150,000 | Pci Advance Title Llc | |
| Na | -- | -- | |
| Dod 12 | -- | -- | |
| Cook Tr W | -- | -- | |
| Cook Trusts | -- | -- | |
| Cook Tr | -- | -- | |
| Cook Tr | -- | -- | |
| Cook | -- | -- | |
| Cook | $150,000 | -- | |
| Watson | $78,000 | -- | |
| Dod 11-20-1989 | -- | -- | |
| Hall | $67,000 | -- |
Source: Public Records
Tax History Compared to Growth
Tax History
| Year | Tax Paid | Tax Assessment Tax Assessment Total Assessment is a certain percentage of the fair market value that is determined by local assessors to be the total taxable value of land and additions on the property. | Land | Improvement |
|---|---|---|---|---|
| 2025 | $3,976 | $94,201 | $20,000 | $74,201 |
| 2024 | $3,438 | $94,201 | $20,000 | $74,201 |
| 2023 | $3,125 | $64,970 | $20,000 | $44,970 |
| 2022 | $3,509 | $64,970 | $20,000 | $44,970 |
| 2021 | $3,500 | $64,970 | $20,000 | $44,970 |
| 2020 | $3,403 | $63,050 | $20,000 | $43,050 |
| 2019 | $3,305 | $63,050 | $20,000 | $43,050 |
| 2018 | $3,079 | $63,050 | $20,000 | $43,050 |
| 2017 | $2,385 | $63,050 | $20,000 | $43,050 |
| 2016 | $2,385 | $63,050 | $20,000 | $43,050 |
| 2015 | $2,100 | $43,660 | $15,000 | $28,660 |
| 2014 | $2,175 | $43,660 | $15,000 | $28,660 |
Source: Public Records
Map
Nearby Homes
- 9087 Bluff Dr
- Lot 4 Winterberry Ln
- Lot 9 Blisslake Ln
- Lot 8 Blisslake Ln
- Lot 2 Winterberry Ln
- Lot 1 Blisslake Ln
- Lot 7 Blisslake Ln
- Lot 3 Winterberry Ln
- 8981 Williams Rd
- 9192 N Park Rd
- 8937 Anew Rd
- LOt 4 S Old Dutch
- 8912 Anew Rd
- 15437 Dutchmans Dr
- 15399 Putman Rd
- 0 Arabian Ln Unit 1307468
- 15445 Putman Rd
- 9117 Grimes Dr
- TBD Putman Rd
- 14555 Zimmerman Ln
- 9205 Williams Rd
- 9194 Williams Rd
- 9198 Williams Rd
- 9174 Bluff Dr
- 9188 Williams Rd
- 8825 Club Dr
- 9218 Williams Rd
- 9116 Williams Rd
- 9149 Bluff Dr
- 9150 Bluff Dr
- 9173 Williams Rd
- 9102 Williams Rd
- 9224 Williams Rd
- 9278 Williams Rd
- 9109 Williams Rd
- 9136 Bluff Dr
- 9082 Williams Rd
- 9181 Andersh Ln
- 15144 Dutchmans Dr
- 9087 Williams Rd