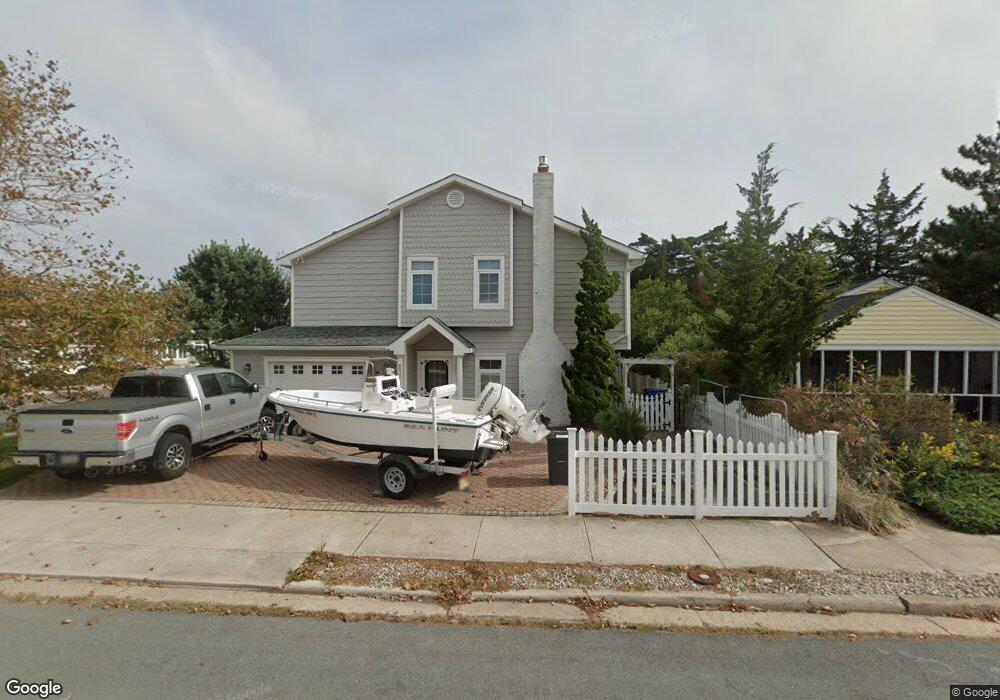
92 11th St W Avalon, NJ 08202
Estimated Value: $2,596,000 - $4,063,000
--
Bed
--
Bath
2,913
Sq Ft
$1,194/Sq Ft
Est. Value
About This Home
This home is located at 92 11th St W, Avalon, NJ 08202 and is currently estimated at $3,478,976, approximately $1,194 per square foot. 92 11th St W is a home located in Cape May County with nearby schools including Avalon Elementary School.
Ownership History
Date
Name
Owned For
Owner Type
Purchase Details
Closed on
Mar 30, 1996
Sold by
Herbert Margaret
Bought by
Curtin Andrew and Curtin Margaret
Current Estimated Value
Home Financials for this Owner
Home Financials are based on the most recent Mortgage that was taken out on this home.
Original Mortgage
$194,000
Outstanding Balance
$9,166
Interest Rate
7.39%
Estimated Equity
$3,469,810
Purchase Details
Closed on
Nov 3, 1989
Sold by
Myerley Margaret
Bought by
Herbert Frank and Herbert Margaret
Create a Home Valuation Report for This Property
The Home Valuation Report is an in-depth analysis detailing your home's value as well as a comparison with similar homes in the area
Home Values in the Area
Average Home Value in this Area
Purchase History
| Date | Buyer | Sale Price | Title Company |
|---|---|---|---|
| Curtin Andrew | $242,000 | -- | |
| Herbert Frank | -- | -- |
Source: Public Records
Mortgage History
| Date | Status | Borrower | Loan Amount |
|---|---|---|---|
| Open | Curtin Andrew | $194,000 |
Source: Public Records
Tax History Compared to Growth
Tax History
| Year | Tax Paid | Tax Assessment Tax Assessment Total Assessment is a certain percentage of the fair market value that is determined by local assessors to be the total taxable value of land and additions on the property. | Land | Improvement |
|---|---|---|---|---|
| 2025 | $9,098 | $1,481,800 | $1,250,000 | $231,800 |
| 2024 | $9,098 | $1,481,800 | $1,250,000 | $231,800 |
| 2023 | $9,024 | $1,481,800 | $1,250,000 | $231,800 |
| 2022 | $8,417 | $1,481,800 | $1,250,000 | $231,800 |
| 2021 | $8,105 | $1,481,800 | $1,250,000 | $231,800 |
| 2020 | $7,794 | $1,481,800 | $1,250,000 | $231,800 |
| 2019 | $7,557 | $1,481,800 | $1,250,000 | $231,800 |
| 2018 | $7,231 | $1,481,800 | $1,250,000 | $231,800 |
| 2017 | $6,559 | $1,179,700 | $945,000 | $234,700 |
| 2016 | $6,488 | $1,179,700 | $945,000 | $234,700 |
| 2015 | $6,382 | $1,179,700 | $945,000 | $234,700 |
| 2014 | $6,311 | $1,179,700 | $945,000 | $234,700 |
Source: Public Records
Map
Nearby Homes