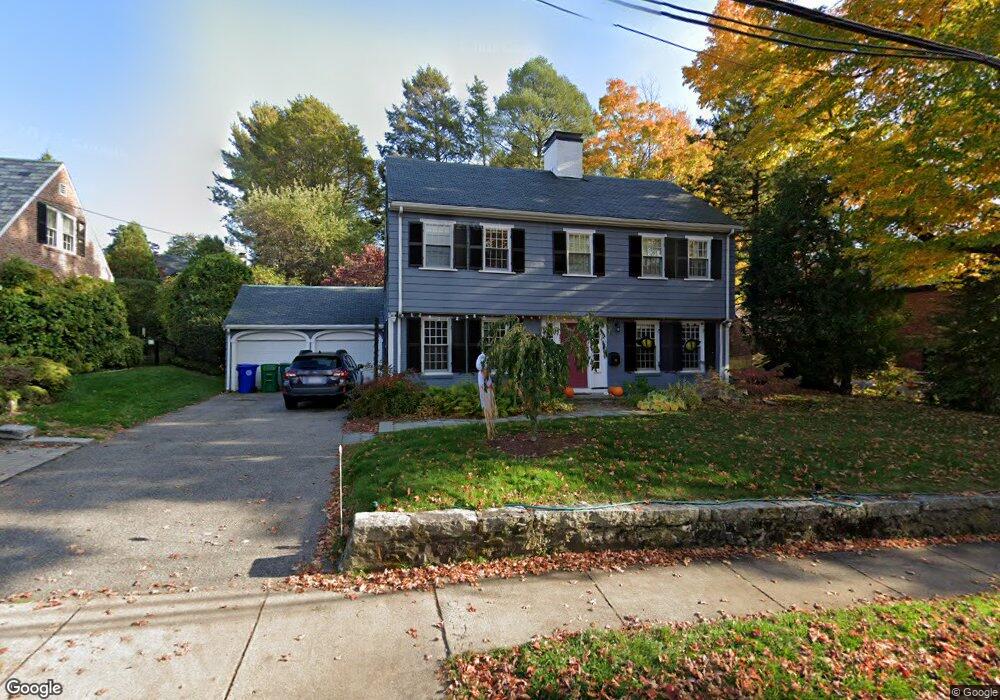
92 Cotton St Newton, MA 02458
Newton Centre NeighborhoodEstimated Value: $1,531,000 - $2,041,000
3
Beds
3
Baths
2,196
Sq Ft
$812/Sq Ft
Est. Value
About This Home
This home is located at 92 Cotton St, Newton, MA 02458 and is currently estimated at $1,783,767, approximately $812 per square foot. 92 Cotton St is a home located in Middlesex County with nearby schools including Ward Elementary School, Bigelow Middle School, and Newton North High School.
Ownership History
Date
Name
Owned For
Owner Type
Purchase Details
Closed on
Jul 27, 2015
Sold by
Apgar Kristen R and Apgar William C
Bought by
Apgar James R and Apgar Elizabeth R
Current Estimated Value
Home Financials for this Owner
Home Financials are based on the most recent Mortgage that was taken out on this home.
Original Mortgage
$315,000
Outstanding Balance
$247,577
Interest Rate
4.01%
Mortgage Type
New Conventional
Estimated Equity
$1,536,190
Create a Home Valuation Report for This Property
The Home Valuation Report is an in-depth analysis detailing your home's value as well as a comparison with similar homes in the area
Home Values in the Area
Average Home Value in this Area
Purchase History
| Date | Buyer | Sale Price | Title Company |
|---|---|---|---|
| Apgar James R | $760,000 | -- |
Source: Public Records
Mortgage History
| Date | Status | Borrower | Loan Amount |
|---|---|---|---|
| Open | Apgar James R | $315,000 |
Source: Public Records
Tax History Compared to Growth
Tax History
| Year | Tax Paid | Tax Assessment Tax Assessment Total Assessment is a certain percentage of the fair market value that is determined by local assessors to be the total taxable value of land and additions on the property. | Land | Improvement |
|---|---|---|---|---|
| 2025 | $14,595 | $1,489,300 | $1,362,200 | $127,100 |
| 2024 | $14,112 | $1,445,900 | $1,322,500 | $123,400 |
| 2023 | $13,414 | $1,317,700 | $1,014,400 | $303,300 |
| 2022 | $12,835 | $1,220,100 | $939,300 | $280,800 |
| 2021 | $12,227 | $1,136,300 | $886,100 | $250,200 |
| 2020 | $11,863 | $1,136,300 | $886,100 | $250,200 |
| 2019 | $11,528 | $1,103,200 | $860,300 | $242,900 |
| 2018 | $11,063 | $1,022,500 | $780,100 | $242,400 |
| 2017 | $10,726 | $964,600 | $735,900 | $228,700 |
| 2016 | $10,259 | $901,500 | $687,800 | $213,700 |
| 2015 | $9,781 | $842,500 | $642,800 | $199,700 |
Source: Public Records
Map
Nearby Homes
- 31 W Boulevard Rd
- 23 Francis St Unit 23-1
- 21 Francis St Unit 21A
- 44 Irving St
- 1004 Centre St
- 92 Grant Ave
- 59 Hyde Ave
- 35 George St Unit 35
- 37 George St Unit 37
- 5 Merrill Rd
- 5 Hammond St
- 73 Elmore St
- 655 Centre St
- 104 Woodchester Dr
- 118 Langdon St
- 3 Cedar St
- 95 Blake St
- 9 The Ledges Rd
- 209 Commonwealth Ave Unit 3E
- 106 Farlow Rd