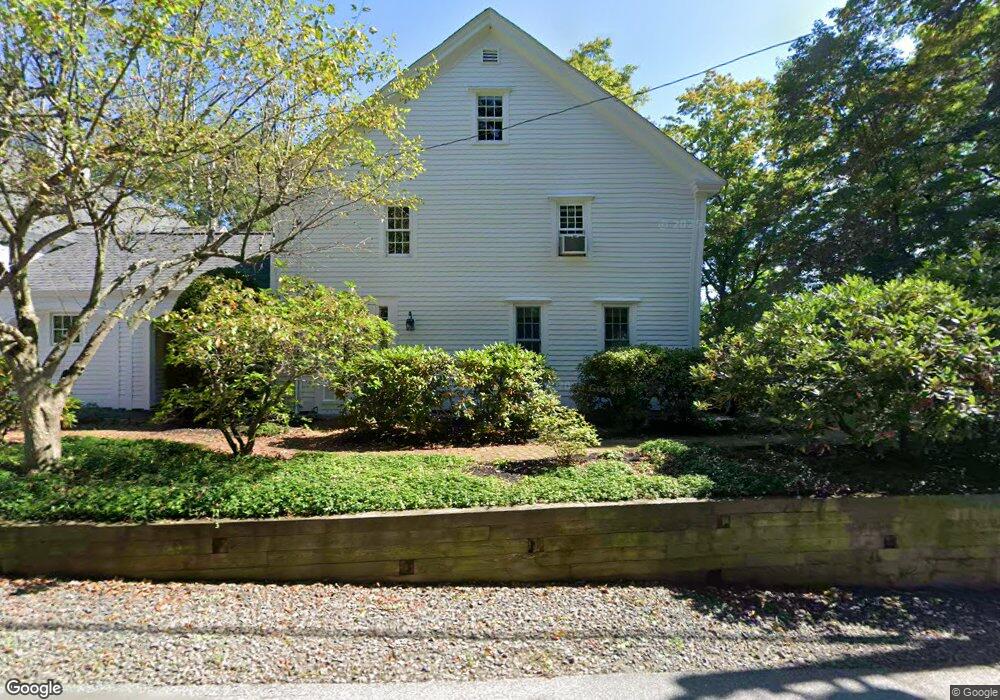
92 Dow Rd Hollis, NH 03049
Hollis NeighborhoodEstimated Value: $1,089,407 - $1,247,000
4
Beds
4
Baths
3,523
Sq Ft
$332/Sq Ft
Est. Value
About This Home
This home is located at 92 Dow Rd, Hollis, NH 03049 and is currently estimated at $1,169,852, approximately $332 per square foot. 92 Dow Rd is a home located in Hillsborough County with nearby schools including Hollis Primary School, Hollis Upper Elementary School, and Hollis-Brookline Middle School.
Ownership History
Date
Name
Owned For
Owner Type
Purchase Details
Closed on
Oct 3, 2003
Sold by
Anderson Kenneth J and Anderson Serena L
Bought by
Reynolds Stephen J and Reynolds Beth A
Current Estimated Value
Home Financials for this Owner
Home Financials are based on the most recent Mortgage that was taken out on this home.
Original Mortgage
$250,000
Outstanding Balance
$116,985
Interest Rate
6.25%
Estimated Equity
$1,052,867
Create a Home Valuation Report for This Property
The Home Valuation Report is an in-depth analysis detailing your home's value as well as a comparison with similar homes in the area
Home Values in the Area
Average Home Value in this Area
Purchase History
| Date | Buyer | Sale Price | Title Company |
|---|---|---|---|
| Reynolds Stephen J | $557,000 | -- |
Source: Public Records
Mortgage History
| Date | Status | Borrower | Loan Amount |
|---|---|---|---|
| Open | Reynolds Stephen J | $250,000 |
Source: Public Records
Tax History Compared to Growth
Tax History
| Year | Tax Paid | Tax Assessment Tax Assessment Total Assessment is a certain percentage of the fair market value that is determined by local assessors to be the total taxable value of land and additions on the property. | Land | Improvement |
|---|---|---|---|---|
| 2024 | $15,450 | $871,400 | $366,600 | $504,800 |
| 2023 | $14,518 | $871,400 | $366,600 | $504,800 |
| 2022 | $19,667 | $871,400 | $366,600 | $504,800 |
| 2021 | $13,840 | $609,700 | $236,600 | $373,100 |
| 2020 | $3,908 | $609,700 | $236,600 | $373,100 |
| 2019 | $14,084 | $609,700 | $236,600 | $373,100 |
| 2018 | $13,212 | $609,700 | $236,600 | $373,100 |
| 2017 | $12,378 | $534,700 | $201,700 | $333,000 |
| 2016 | $12,528 | $534,700 | $201,700 | $333,000 |
| 2015 | $12,309 | $534,700 | $201,700 | $333,000 |
| 2014 | $12,368 | $534,700 | $201,700 | $333,000 |
| 2013 | $12,202 | $534,700 | $201,700 | $333,000 |
Source: Public Records
Map
Nearby Homes