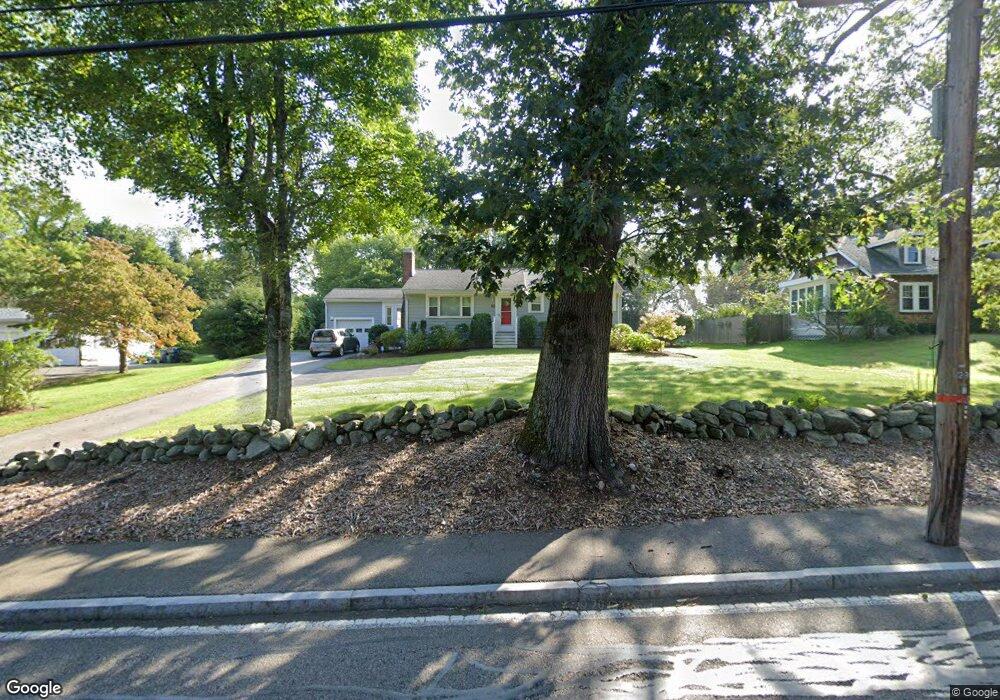
92 Glen St Natick, MA 01760
Estimated Value: $798,000 - $1,061,000
3
Beds
1
Bath
960
Sq Ft
$946/Sq Ft
Est. Value
About This Home
This home is located at 92 Glen St, Natick, MA 01760 and is currently estimated at $908,597, approximately $946 per square foot. 92 Glen St is a home located in Middlesex County with nearby schools including Natick High School, Memorial Elementary School, and J F Kennedy Middle School.
Ownership History
Date
Name
Owned For
Owner Type
Purchase Details
Closed on
May 9, 2024
Sold by
Shea Susan A
Bought by
Susan A Shea Ret and Shea
Current Estimated Value
Purchase Details
Closed on
Jun 23, 2016
Sold by
Lupfer Donald R and Shea Susan A
Bought by
Shea Susan A
Create a Home Valuation Report for This Property
The Home Valuation Report is an in-depth analysis detailing your home's value as well as a comparison with similar homes in the area
Home Values in the Area
Average Home Value in this Area
Purchase History
| Date | Buyer | Sale Price | Title Company |
|---|---|---|---|
| Susan A Shea Ret | -- | None Available | |
| Susan A Shea Ret | -- | None Available | |
| Shea Susan A | -- | -- | |
| Shea Susan A | -- | -- |
Source: Public Records
Mortgage History
| Date | Status | Borrower | Loan Amount |
|---|---|---|---|
| Previous Owner | Shea Susan A | $20,000 | |
| Previous Owner | Shea Susan A | $150,000 | |
| Previous Owner | Shea Susan A | $125,000 |
Source: Public Records
Tax History
| Year | Tax Paid | Tax Assessment Tax Assessment Total Assessment is a certain percentage of the fair market value that is determined by local assessors to be the total taxable value of land and additions on the property. | Land | Improvement |
|---|---|---|---|---|
| 2025 | $8,139 | $680,500 | $517,000 | $163,500 |
| 2024 | $7,920 | $646,000 | $489,700 | $156,300 |
| 2023 | $7,646 | $604,900 | $453,400 | $151,500 |
| 2022 | $7,342 | $550,400 | $406,900 | $143,500 |
| 2021 | $7,058 | $518,600 | $385,400 | $133,200 |
| 2020 | $6,839 | $502,500 | $369,400 | $133,100 |
| 2019 | $5,571 | $502,500 | $369,400 | $133,100 |
| 2018 | $5,811 | $445,300 | $353,300 | $92,000 |
| 2017 | $0 | $429,700 | $339,400 | $90,300 |
| 2016 | $5,820 | $428,900 | $339,400 | $89,500 |
| 2015 | $5,825 | $421,500 | $339,400 | $82,100 |
Source: Public Records
Map
Nearby Homes
Your Personal Tour Guide
Ask me questions while you tour the home.