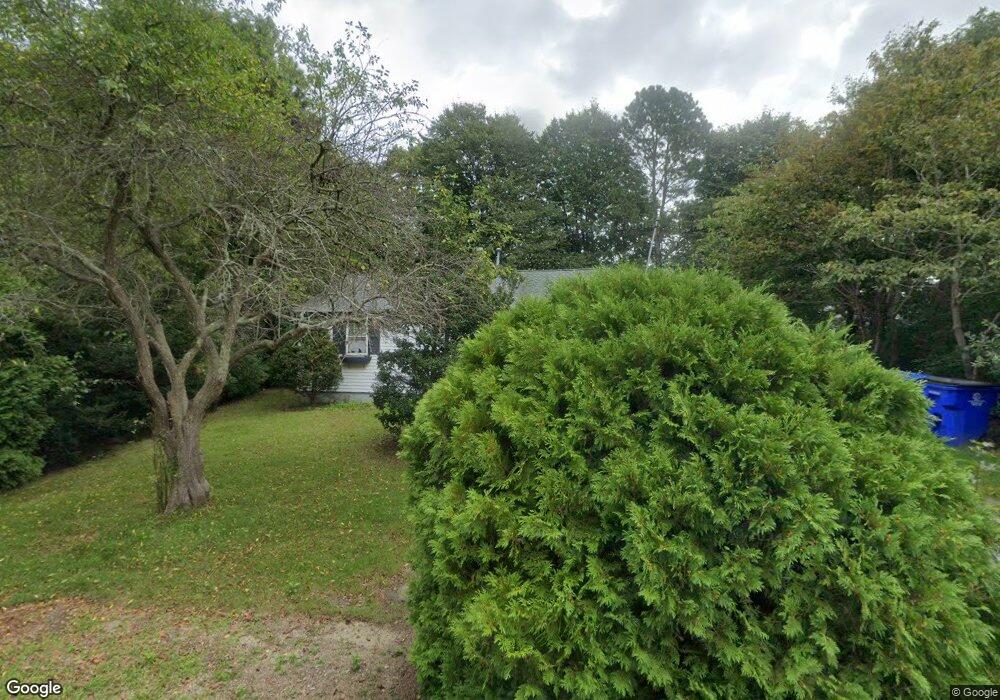
92 Handy Rd Pocasset, MA 02559
Pocasset NeighborhoodEstimated Value: $380,000 - $475,000
2
Beds
1
Bath
768
Sq Ft
$560/Sq Ft
Est. Value
About This Home
This home is located at 92 Handy Rd, Pocasset, MA 02559 and is currently estimated at $430,075, approximately $559 per square foot. 92 Handy Rd is a home located in Barnstable County with nearby schools including Bourne High School, Cadence Academy Preschool - Bourne, and St Margaret Regional School.
Ownership History
Date
Name
Owned For
Owner Type
Purchase Details
Closed on
Nov 30, 2007
Sold by
Mcdonough Kathleen E
Bought by
Maio Robert P
Current Estimated Value
Home Financials for this Owner
Home Financials are based on the most recent Mortgage that was taken out on this home.
Original Mortgage
$207,000
Outstanding Balance
$131,050
Interest Rate
6.48%
Mortgage Type
Purchase Money Mortgage
Estimated Equity
$299,025
Create a Home Valuation Report for This Property
The Home Valuation Report is an in-depth analysis detailing your home's value as well as a comparison with similar homes in the area
Home Values in the Area
Average Home Value in this Area
Purchase History
| Date | Buyer | Sale Price | Title Company |
|---|---|---|---|
| Maio Robert P | $230,000 | -- | |
| Maio Robert P | $230,000 | -- |
Source: Public Records
Mortgage History
| Date | Status | Borrower | Loan Amount |
|---|---|---|---|
| Open | Maio Robert P | $207,000 | |
| Closed | Maio Robert P | $207,000 |
Source: Public Records
Tax History Compared to Growth
Tax History
| Year | Tax Paid | Tax Assessment Tax Assessment Total Assessment is a certain percentage of the fair market value that is determined by local assessors to be the total taxable value of land and additions on the property. | Land | Improvement |
|---|---|---|---|---|
| 2025 | $2,626 | $336,200 | $191,900 | $144,300 |
| 2024 | $2,702 | $336,900 | $199,400 | $137,500 |
| 2023 | $2,417 | $274,400 | $176,500 | $97,900 |
| 2022 | $2,229 | $220,900 | $143,200 | $77,700 |
| 2021 | $2,111 | $196,000 | $130,300 | $65,700 |
| 2020 | $2,056 | $191,400 | $129,100 | $62,300 |
| 2019 | $1,975 | $187,900 | $129,100 | $58,800 |
| 2018 | $1,946 | $184,600 | $128,500 | $56,100 |
| 2017 | $1,883 | $182,800 | $127,300 | $55,500 |
| 2016 | $1,831 | $180,200 | $127,300 | $52,900 |
| 2015 | $1,425 | $141,500 | $88,600 | $52,900 |
Source: Public Records
Map
Nearby Homes
- 7 Portside Dr
- 7 4th Ave
- 15 1st St
- 174 Barlows Landing Rd
- 940 County Rd
- 940 County Rd
- 709 County Rd
- 254 Barlows Landing Rd
- 39 Bennets Neck Dr
- 1094 County Rd
- 3 Red Brook Pond Dr
- 16 Tara Terrace
- 515 County Rd
- 171 Bellavista Dr
- 48 Red Brook Harbor Rd
- 501 County Rd
- 22 Nairn Rd
- 1234 Route 28a
- 14 Navajo Rd
- 1234 Route 28a