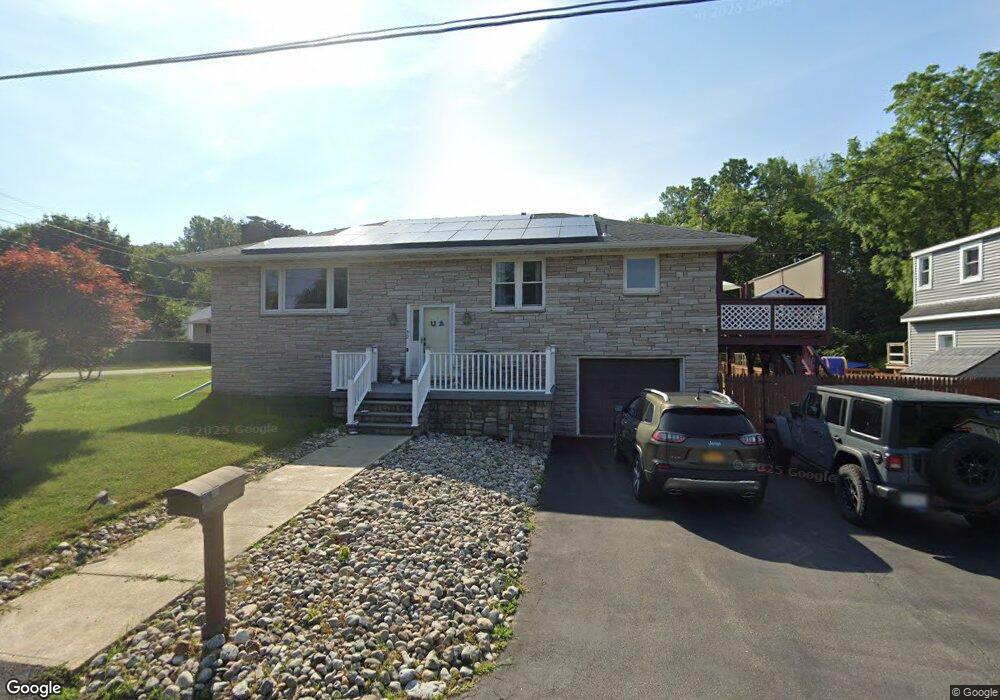
92 Huron St Albany, NY 12203
Campus Area NeighborhoodEstimated Value: $339,000 - $378,000
3
Beds
3
Baths
2,214
Sq Ft
$161/Sq Ft
Est. Value
About This Home
This home is located at 92 Huron St, Albany, NY 12203 and is currently estimated at $355,830, approximately $160 per square foot. 92 Huron St is a home located in Albany County with nearby schools including Eagle Point Elementary School, William S Hackett Middle School, and Albany High School.
Ownership History
Date
Name
Owned For
Owner Type
Purchase Details
Closed on
Jun 17, 2022
Sold by
Mall Obeid C
Bought by
Mall Isaac D and Mall Giavanna C
Current Estimated Value
Home Financials for this Owner
Home Financials are based on the most recent Mortgage that was taken out on this home.
Original Mortgage
$234,000
Outstanding Balance
$220,794
Interest Rate
5.3%
Mortgage Type
New Conventional
Estimated Equity
$135,036
Purchase Details
Closed on
Jul 6, 2016
Sold by
Mall Obeid C and Mall Almas C
Bought by
Mall Jesse Afzal and Mall Kiran Jesse
Purchase Details
Closed on
Jan 5, 2016
Sold by
Mall Obeid C and Mall Almas C
Bought by
Mall Obeid C and Mall Almas C
Purchase Details
Closed on
Aug 11, 2003
Sold by
Fazio Anthony
Bought by
Mall Obeid C
Create a Home Valuation Report for This Property
The Home Valuation Report is an in-depth analysis detailing your home's value as well as a comparison with similar homes in the area
Home Values in the Area
Average Home Value in this Area
Purchase History
| Date | Buyer | Sale Price | Title Company |
|---|---|---|---|
| Mall Isaac D | $260,000 | None Listed On Document | |
| Mall Jesse Afzal | -- | None Available | |
| Mall Obeid C | -- | None Available | |
| Mall Obeid C | -- | None Available | |
| Mall Obeid C | $180,000 | Michael Mc Kinley |
Source: Public Records
Mortgage History
| Date | Status | Borrower | Loan Amount |
|---|---|---|---|
| Open | Mall Isaac D | $234,000 |
Source: Public Records
Tax History
| Year | Tax Paid | Tax Assessment Tax Assessment Total Assessment is a certain percentage of the fair market value that is determined by local assessors to be the total taxable value of land and additions on the property. | Land | Improvement |
|---|---|---|---|---|
| 2025 | $8,563 | $332,000 | $66,400 | $265,600 |
| 2024 | $8,563 | $332,000 | $66,400 | $265,600 |
| 2023 | $6,988 | $175,000 | $36,000 | $139,000 |
| 2022 | $5,791 | $175,000 | $36,000 | $139,000 |
| 2021 | $4,824 | $175,000 | $36,000 | $139,000 |
| 2020 | $5,019 | $175,000 | $36,000 | $139,000 |
| 2019 | $5,415 | $175,000 | $36,000 | $139,000 |
| 2018 | $5,138 | $175,000 | $36,000 | $139,000 |
| 2017 | $1,905 | $175,000 | $36,000 | $139,000 |
| 2016 | $4,972 | $175,000 | $36,000 | $139,000 |
| 2015 | $5,101 | $180,400 | $36,100 | $144,300 |
| 2014 | -- | $180,400 | $36,100 | $144,300 |
Source: Public Records
Map
Nearby Homes
Your Personal Tour Guide
Ask me questions while you tour the home.