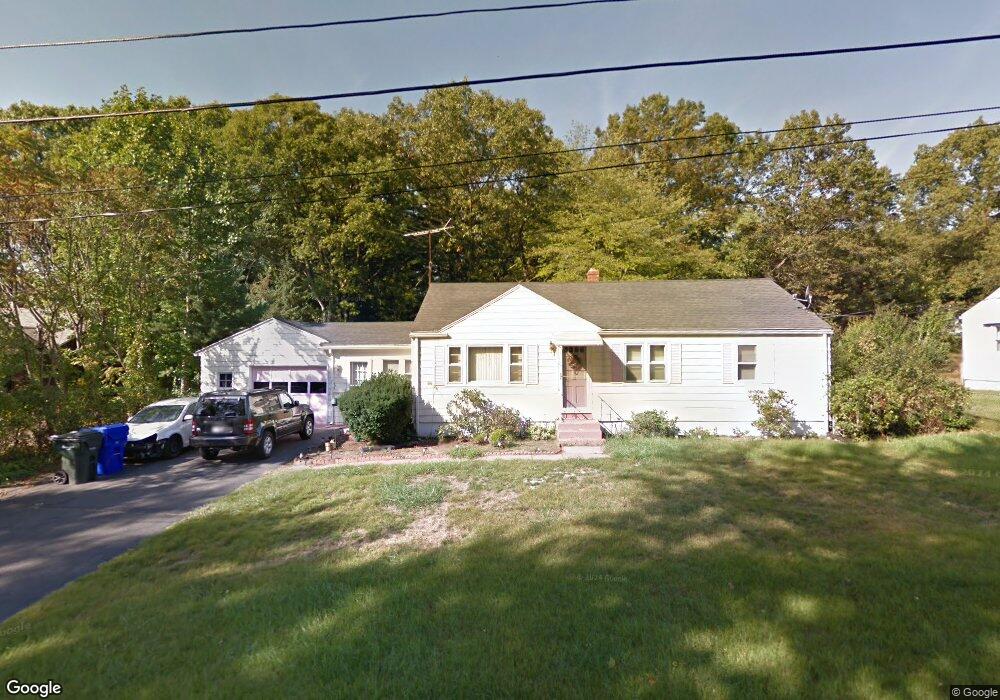
92 Juniper Dr Springfield, MA 01119
Sixteen Acres NeighborhoodEstimated Value: $308,623 - $330,000
3
Beds
1
Bath
1,100
Sq Ft
$293/Sq Ft
Est. Value
About This Home
This home is located at 92 Juniper Dr, Springfield, MA 01119 and is currently estimated at $321,906, approximately $292 per square foot. 92 Juniper Dr is a home located in Hampden County with nearby schools including Mary M. Lynch Elementary School, John J Duggan Middle, and Springfield Central High School.
Ownership History
Date
Name
Owned For
Owner Type
Purchase Details
Closed on
Oct 3, 1994
Sold by
Corcoran Lydia T
Bought by
Lyew Mark A and Lyew Denise Taylor
Current Estimated Value
Home Financials for this Owner
Home Financials are based on the most recent Mortgage that was taken out on this home.
Original Mortgage
$76,900
Interest Rate
8.5%
Mortgage Type
Purchase Money Mortgage
Create a Home Valuation Report for This Property
The Home Valuation Report is an in-depth analysis detailing your home's value as well as a comparison with similar homes in the area
Home Values in the Area
Average Home Value in this Area
Purchase History
| Date | Buyer | Sale Price | Title Company |
|---|---|---|---|
| Lyew Mark A | $77,000 | -- |
Source: Public Records
Mortgage History
| Date | Status | Borrower | Loan Amount |
|---|---|---|---|
| Closed | Lyew Mark A | $14,000 | |
| Closed | Lyew Mark A | $76,900 | |
| Previous Owner | Lyew Mark A | $25,000 |
Source: Public Records
Tax History
| Year | Tax Paid | Tax Assessment Tax Assessment Total Assessment is a certain percentage of the fair market value that is determined by local assessors to be the total taxable value of land and additions on the property. | Land | Improvement |
|---|---|---|---|---|
| 2025 | $4,020 | $256,400 | $54,400 | $202,000 |
| 2024 | $3,628 | $225,900 | $54,400 | $171,500 |
| 2023 | $3,291 | $193,000 | $51,800 | $141,200 |
| 2022 | $3,228 | $171,500 | $51,800 | $119,700 |
| 2021 | $3,003 | $158,900 | $47,100 | $111,800 |
| 2020 | $2,978 | $152,500 | $47,100 | $105,400 |
| 2019 | $2,771 | $140,800 | $47,100 | $93,700 |
| 2018 | $2,751 | $139,800 | $47,100 | $92,700 |
| 2017 | $2,729 | $138,800 | $46,800 | $92,000 |
| 2016 | $2,499 | $127,100 | $46,800 | $80,300 |
| 2015 | $2,504 | $127,300 | $46,800 | $80,500 |
Source: Public Records
Map
Nearby Homes
- 84 Juniper Dr
- 102 Juniper Dr
- 49 N Branch Pkwy
- 59 N Branch Pkwy
- 76 Juniper Dr
- 89 Juniper Dr
- 99 Juniper Dr
- 52 N Brook Rd
- 41 N Branch Pkwy
- 81 Juniper Dr
- 67 N Branch Pkwy
- 64 N Brook Rd
- 66 Juniper Dr
- 73 Juniper Dr
- 31 N Branch Pkwy
- 32 N Brook Rd
- 77 N Branch Pkwy
- 74 N Brook Rd
- 94 Northway Dr
- 102 Northway Dr
Your Personal Tour Guide
Ask me questions while you tour the home.