92 Maegan Place Unit 2003 Thousand Oaks, CA 91362
Estimated Value: $456,119 - $500,000
2
Beds
1
Bath
810
Sq Ft
$594/Sq Ft
Est. Value
About This Home
This home is located at 92 Maegan Place Unit 2003, Thousand Oaks, CA 91362 and is currently estimated at $481,030, approximately $593 per square foot. 92 Maegan Place Unit 2003 is a home located in Ventura County with nearby schools including Conejo Elementary School, Colina Middle School, and Westlake High School.
Ownership History
Date
Name
Owned For
Owner Type
Purchase Details
Closed on
Aug 30, 2017
Sold by
Sodukh Ksenila
Bought by
Sodukh Eduard
Current Estimated Value
Home Financials for this Owner
Home Financials are based on the most recent Mortgage that was taken out on this home.
Original Mortgage
$319,113
Interest Rate
3.62%
Mortgage Type
FHA
Purchase Details
Closed on
Jul 13, 2017
Sold by
Leibman Ann Marie
Bought by
Sodukh Eduard
Home Financials for this Owner
Home Financials are based on the most recent Mortgage that was taken out on this home.
Original Mortgage
$319,113
Interest Rate
3.62%
Mortgage Type
FHA
Purchase Details
Closed on
Jun 8, 2007
Sold by
Woodworth Charles E
Bought by
Leibman Ann Marie
Home Financials for this Owner
Home Financials are based on the most recent Mortgage that was taken out on this home.
Original Mortgage
$295,000
Interest Rate
6.16%
Mortgage Type
Purchase Money Mortgage
Create a Home Valuation Report for This Property
The Home Valuation Report is an in-depth analysis detailing your home's value as well as a comparison with similar homes in the area
Home Values in the Area
Average Home Value in this Area
Purchase History
| Date | Buyer | Sale Price | Title Company |
|---|---|---|---|
| Sodukh Eduard | -- | Fidelity National Title Co | |
| Sodukh Eduard | $325,000 | Fidelity National Title Co | |
| Leibman Ann Marie | $295,000 | Lawyers Title Company |
Source: Public Records
Mortgage History
| Date | Status | Borrower | Loan Amount |
|---|---|---|---|
| Previous Owner | Sodukh Eduard | $319,113 | |
| Previous Owner | Leibman Ann Marie | $295,000 |
Source: Public Records
Tax History Compared to Growth
Tax History
| Year | Tax Paid | Tax Assessment Tax Assessment Total Assessment is a certain percentage of the fair market value that is determined by local assessors to be the total taxable value of land and additions on the property. | Land | Improvement |
|---|---|---|---|---|
| 2025 | $4,300 | $369,789 | $240,080 | $129,709 |
| 2024 | $4,300 | $362,539 | $235,373 | $127,166 |
| 2023 | $4,162 | $355,431 | $230,758 | $124,673 |
| 2022 | $4,087 | $348,462 | $226,233 | $122,229 |
| 2021 | $4,016 | $341,630 | $221,797 | $119,833 |
| 2020 | $3,610 | $338,129 | $219,524 | $118,605 |
| 2019 | $3,515 | $331,500 | $215,220 | $116,280 |
| 2018 | $3,445 | $325,000 | $211,000 | $114,000 |
| 2017 | $2,957 | $285,000 | $187,000 | $98,000 |
| 2016 | $2,735 | $261,000 | $171,000 | $90,000 |
| 2015 | $2,570 | $246,000 | $161,000 | $85,000 |
| 2014 | $2,524 | $239,000 | $156,000 | $83,000 |
Source: Public Records
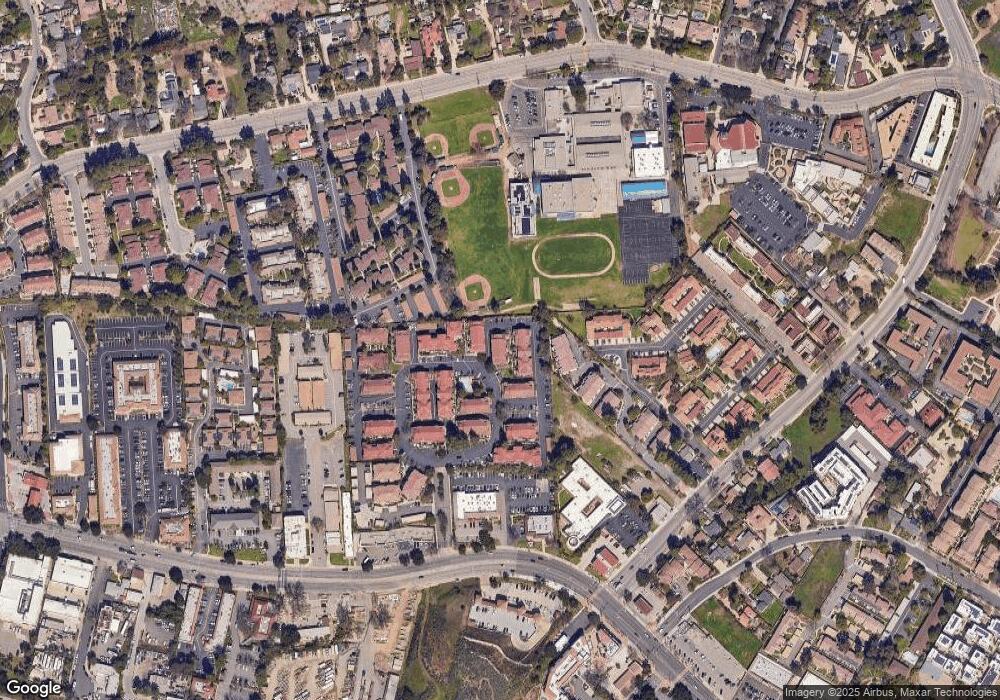
Map
Nearby Homes
- 86 Maegan Place Unit 4
- 56 Maegan Place Unit 4
- 68 Maegan Place Unit 7
- 62 Maegan Place Unit 4
- 110 Maegan Place Unit 13
- 96 Erbes Rd
- 170 Erbes Rd
- 1710 E Thousand Oaks Blvd
- 1342 E Hillcrest Dr Unit 20
- 1340 E Hillcrest Dr Unit 8
- 918 Rancho Rd
- 295 Toyon Ct
- 2193 Los Feliz Dr Unit 63
- 567 Lone Oak Dr
- 361 Toyon Ct
- 566 Rancho Rd
- 1649 Hauser Cir
- 554 Lone Oak Dr
- 1000 E Thousand Oaks Blvd
- 978 Bower Way
- 92 Maegan Place Unit 7
- 92 Maegan Place
- 92 Maegan Place Unit 4
- 92 Maegan Place Unit 6
- 92 Maegan Place Unit 7
- 92 Maegan Place Unit 8
- 92 Maegan Place Unit 9
- 92 Maegan Place Unit 1
- 92 Maegan Place Unit 2
- 92 Maegan Place Unit 3
- 86 Maegan Place Unit 11
- 86 Maegan Place Unit 10
- 86 Maegan Place Unit 9
- 86 Maegan Place Unit J13
- 86 Maegan Place Unit 12
- 86 Maegan Place
- 86 Maegan Place Unit 9
- 86 Maegan Place Unit 8
- 86 Maegan Place Unit 7
- 86 Maegan Place Unit 6