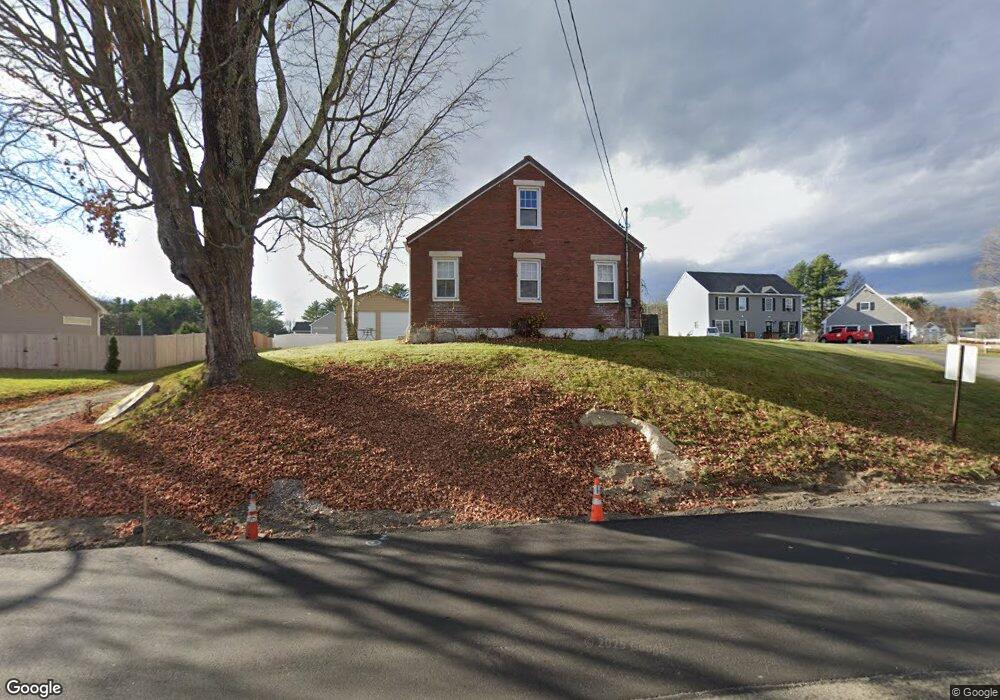
92 Main St Unit Lot 2 Windham, ME 04062
Estimated Value: $402,000 - $446,835
3
Beds
3
Baths
1,634
Sq Ft
$263/Sq Ft
Est. Value
About This Home
This home is located at 92 Main St Unit Lot 2, Windham, ME 04062 and is currently estimated at $430,459, approximately $263 per square foot. 92 Main St Unit Lot 2 is a home located in Cumberland County with nearby schools including Windham Primary School, Manchester School, and Windham Middle School.
Ownership History
Date
Name
Owned For
Owner Type
Purchase Details
Closed on
Dec 29, 2023
Sold by
Hines Alan F
Bought by
Rotolo Annmarie and Clain Jacob J
Current Estimated Value
Home Financials for this Owner
Home Financials are based on the most recent Mortgage that was taken out on this home.
Original Mortgage
$280,000
Outstanding Balance
$274,916
Interest Rate
7.29%
Mortgage Type
Purchase Money Mortgage
Estimated Equity
$155,543
Purchase Details
Closed on
Jun 19, 2020
Sold by
Sm & A Properties Llc
Bought by
Hines Alan F
Home Financials for this Owner
Home Financials are based on the most recent Mortgage that was taken out on this home.
Original Mortgage
$211,105
Interest Rate
3.2%
Mortgage Type
FHA
Purchase Details
Closed on
Jul 1, 2019
Sold by
Bonin David A
Bought by
Sm & A Properties Llc
Create a Home Valuation Report for This Property
The Home Valuation Report is an in-depth analysis detailing your home's value as well as a comparison with similar homes in the area
Home Values in the Area
Average Home Value in this Area
Purchase History
| Date | Buyer | Sale Price | Title Company |
|---|---|---|---|
| Rotolo Annmarie | $350,000 | None Available | |
| Hines Alan F | -- | None Available | |
| Sm & A Properties Llc | -- | -- |
Source: Public Records
Mortgage History
| Date | Status | Borrower | Loan Amount |
|---|---|---|---|
| Open | Rotolo Annmarie | $280,000 | |
| Previous Owner | Hines Alan F | $211,105 |
Source: Public Records
Tax History Compared to Growth
Tax History
| Year | Tax Paid | Tax Assessment Tax Assessment Total Assessment is a certain percentage of the fair market value that is determined by local assessors to be the total taxable value of land and additions on the property. | Land | Improvement |
|---|---|---|---|---|
| 2024 | $4,320 | $376,600 | $130,800 | $245,800 |
| 2023 | $3,994 | $356,600 | $121,600 | $235,000 |
| 2022 | $3,204 | $276,000 | $107,700 | $168,300 |
| 2021 | $3,053 | $242,300 | $93,700 | $148,600 |
| 2020 | $2,519 | $238,300 | $82,400 | $155,900 |
| 2019 | $2,455 | $167,700 | $82,400 | $85,300 |
| 2018 | $3,258 | $214,600 | $79,700 | $134,900 |
| 2017 | $3,064 | $186,500 | $72,800 | $113,700 |
| 2016 | $2,928 | $186,500 | $72,800 | $113,700 |
| 2015 | $2,825 | $186,500 | $72,800 | $113,700 |
| 2014 | $2,589 | $186,500 | $72,800 | $113,700 |
| 2013 | -- | $186,500 | $72,800 | $113,700 |
Source: Public Records
Map
Nearby Homes