
Seller's Agent in 2018
Ray Durling
Leading Edge Real Estate
(978) 770-8099
17 in this area
152 Total Sales
Estimated Value: $381,000 - $476,371
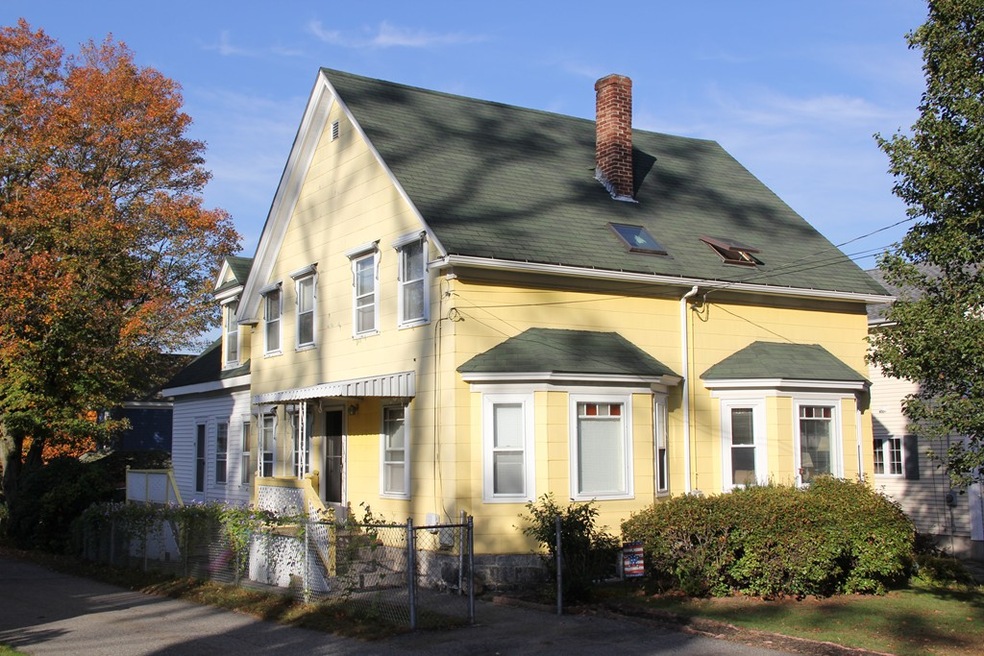
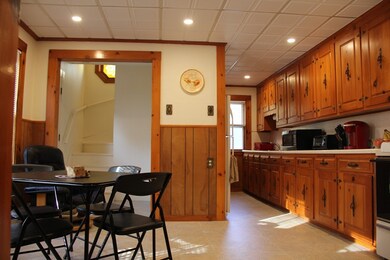
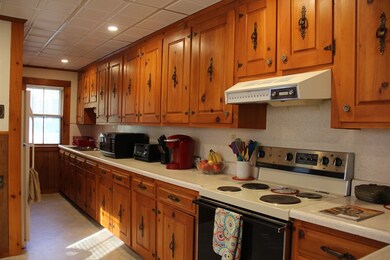
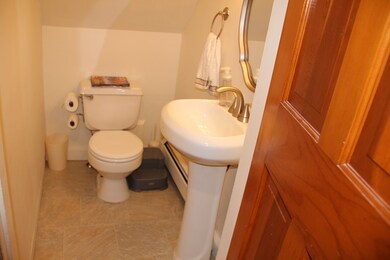
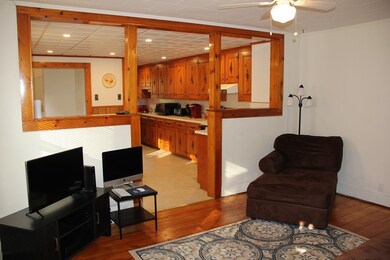
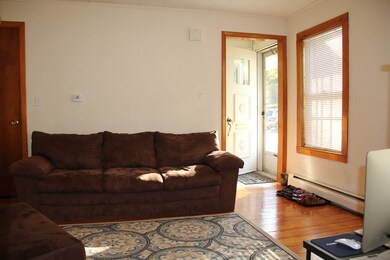
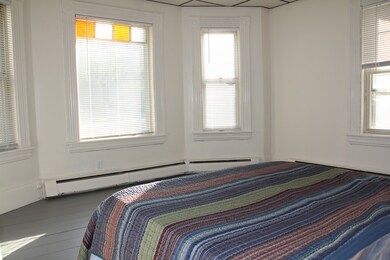
Why Rent? Downtown Condex living that lives like a single family! Why Drive? Quaint tree-lined street close to downtown shops/restaurants, park, Whole Foods, train station & post office - even the Oak & Iron Brewery is close by! Inside you'll find a sunny, open concept first floor including large living spaces including a warm & sunny street-facing living room and a recently updated half bath. Upstairs via either of 2 staircases find 3 large rooms and a full bath. Mix/match those rooms to fit your lifestyle - all have closets, and just 2 of the 3 are counted as bedrooms. Everything downtown Andover has to offer, without the ever-increasing rent payments!
Home Type
Condominium
Year Built
1900
Lot Details
0 Sq Ft Lot
We collect this data history from publicly available records. To have your information removed, we recommend requesting removal directly through your county’s website.
We collect this data history from publicly available records. To have your information removed, we recommend requesting removal directly through your county’s website.
| Date | Buyer | Sale Price | Title Company |
|---|---|---|---|
| -- | None Available | ||
| -- | -- |
We collect this data history from publicly available records. To have your information removed, we recommend requesting removal directly through your county’s website.
| Date | Event | Price | List to Sale | Price per Sq Ft |
|---|---|---|---|---|
| 03/23/2018 03/23/18 | Sold | $230,000 | -6.1% | $171 / Sq Ft |
| 11/24/2017 11/24/17 | Pending | -- | -- | -- |
| 11/16/2017 11/16/17 | Price Changed | $245,000 | -5.7% | $182 / Sq Ft |
| 10/26/2017 10/26/17 | For Sale | $259,900 | -- | $194 / Sq Ft |
We collect this data history from publicly available records. To have your information removed, we recommend requesting removal directly through your county’s website.
| Year | Tax Paid | Tax Assessment Tax Assessment Total Assessment is a certain percentage of the fair market value that is determined by local assessors to be the total taxable value of land and additions on the property. | Land | Improvement |
|---|---|---|---|---|
| 2025 | $4,380 | $350,700 | $0 | $350,700 |
| 2024 | $4,267 | $331,300 | $0 | $331,300 |
| 2023 | $4,091 | $299,500 | $0 | $299,500 |
| 2022 | $4,046 | $277,100 | $0 | $277,100 |
| 2021 | $4,176 | $273,100 | $0 | $273,100 |
| 2020 | $3,802 | $253,300 | $0 | $253,300 |
| 2019 | $3,708 | $242,800 | $0 | $242,800 |
| 2018 | $3,527 | $225,500 | $0 | $225,500 |
| 2017 | $3,282 | $216,200 | $0 | $216,200 |
| 2016 | $3,145 | $212,200 | $0 | $212,200 |
| 2015 | $2,978 | $198,900 | $0 | $198,900 |
Seller's Agent in 2018
Ray Durling
Leading Edge Real Estate
(978) 770-8099
17 in this area
152 Total Sales
Source: MLS Property Information Network (MLS PIN)
MLS Number: 72248047
APN: ANDO-000038-000164-000092
Disclaimer: Certain information contained herein is derived from information provided by parties other than Homes.com. All information provided is deemed reliable, but is not guaranteed to be accurate and should be independently verified.
![]() The property listing data and information, or the Images, set forth herein were provided to MLS Property Information Network, Inc. from third party sources, including sellers, lessors and public records, and were compiled by MLS Property Information Network, Inc. The property listing data and information, and the Images, are for the personal, non-commercial use of consumers having a good faith interest in purchasing or leasing listed properties of the type displayed to them and may not be used for any purpose other than to identify prospective properties which such consumers may have a good faith interest in purchasing or leasing. MLS Property Information Network, Inc. and its subscribers disclaim any and all representations and warranties as to the accuracy of the property listing data and information, or as to the accuracy of any of the Images, set forth herein.
The property listing data and information, or the Images, set forth herein were provided to MLS Property Information Network, Inc. from third party sources, including sellers, lessors and public records, and were compiled by MLS Property Information Network, Inc. The property listing data and information, and the Images, are for the personal, non-commercial use of consumers having a good faith interest in purchasing or leasing listed properties of the type displayed to them and may not be used for any purpose other than to identify prospective properties which such consumers may have a good faith interest in purchasing or leasing. MLS Property Information Network, Inc. and its subscribers disclaim any and all representations and warranties as to the accuracy of the property listing data and information, or as to the accuracy of any of the Images, set forth herein.
Ask me questions while you tour the home.