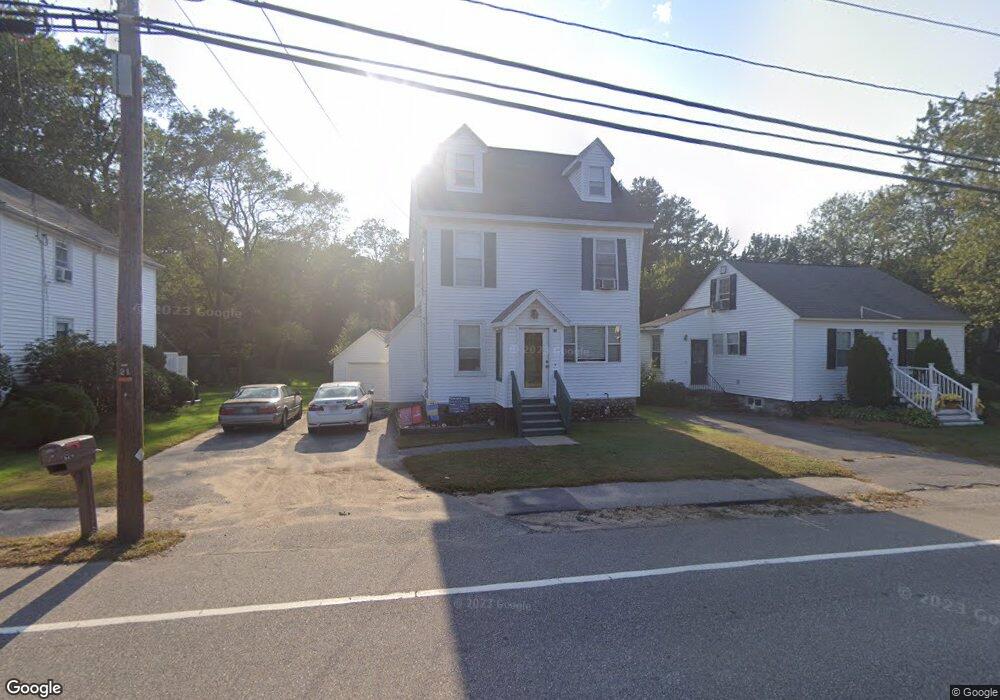
92 North St Andover, MA 01810
Far West Andover NeighborhoodEstimated Value: $676,000 - $824,000
4
Beds
3
Baths
1,770
Sq Ft
$434/Sq Ft
Est. Value
About This Home
This home is located at 92 North St, Andover, MA 01810 and is currently estimated at $767,753, approximately $433 per square foot. 92 North St is a home located in Essex County with nearby schools including High Plain Elementary School, Wood Hill Middle School, and Andover High School.
Ownership History
Date
Name
Owned For
Owner Type
Purchase Details
Closed on
Sep 28, 2001
Sold by
Oleary Ken M and Oleary Lisa A
Bought by
Yannalfo Paul F
Current Estimated Value
Home Financials for this Owner
Home Financials are based on the most recent Mortgage that was taken out on this home.
Original Mortgage
$267,600
Interest Rate
6.91%
Mortgage Type
Purchase Money Mortgage
Create a Home Valuation Report for This Property
The Home Valuation Report is an in-depth analysis detailing your home's value as well as a comparison with similar homes in the area
Home Values in the Area
Average Home Value in this Area
Purchase History
| Date | Buyer | Sale Price | Title Company |
|---|---|---|---|
| Yannalfo Paul F | $334,500 | -- | |
| Yannalfo Paul F | $334,500 | -- |
Source: Public Records
Mortgage History
| Date | Status | Borrower | Loan Amount |
|---|---|---|---|
| Open | Yannalfo Paul F | $300,000 | |
| Closed | Yannalfo Paul F | $267,600 | |
| Closed | Yannalfo Paul F | $33,000 |
Source: Public Records
Tax History
| Year | Tax Paid | Tax Assessment Tax Assessment Total Assessment is a certain percentage of the fair market value that is determined by local assessors to be the total taxable value of land and additions on the property. | Land | Improvement |
|---|---|---|---|---|
| 2024 | $7,052 | $547,500 | $240,200 | $307,300 |
| 2023 | $6,823 | $499,500 | $222,500 | $277,000 |
| 2022 | $6,437 | $440,900 | $188,600 | $252,300 |
| 2021 | $6,160 | $402,900 | $171,500 | $231,400 |
| 2020 | $5,908 | $393,600 | $167,300 | $226,300 |
| 2019 | $5,822 | $381,300 | $160,900 | $220,400 |
| 2018 | $5,541 | $354,300 | $151,900 | $202,400 |
| 2017 | $5,308 | $349,700 | $149,000 | $200,700 |
| 2016 | $5,183 | $349,700 | $149,000 | $200,700 |
| 2015 | $4,973 | $332,200 | $143,200 | $189,000 |
Source: Public Records
Map
Nearby Homes
- 2 Boardwalk Dr
- 750 Brookside Dr Unit G
- 9 Oakland Rd
- 2 Weeping Willow Dr
- 5 Weeping Willow Dr
- 0
- 4 Richard Cir
- 35 Adams St
- 58 Chandler Rd
- 1146 Essex St
- 37 Tewksbury St Unit 39
- 18 Doyle St
- 1100 Essex St
- 1082 Essex St
- 19 Oregon Ave
- 312 Water St Unit 4
- 543 Andover St Unit 6
- 13 Caswell Ave
- 95 Hancock St
- 42-44 Cypress Ave
Your Personal Tour Guide
Ask me questions while you tour the home.