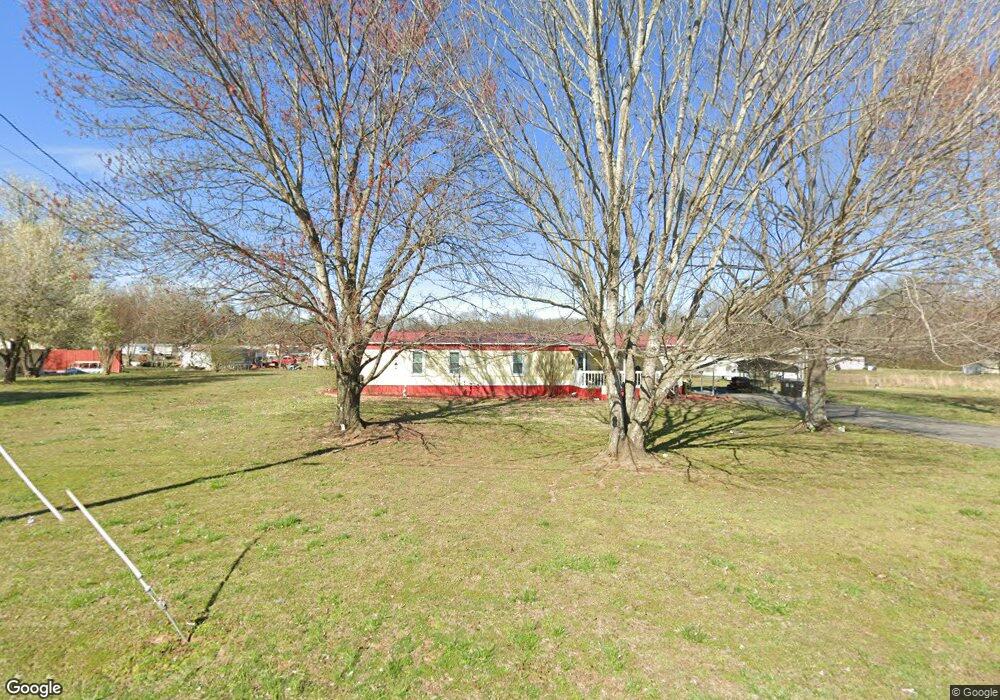
92 Pebble Dr Dunlap, TN 37327
Estimated Value: $228,000 - $378,000
Studio
1
Bath
1,520
Sq Ft
$190/Sq Ft
Est. Value
About This Home
This home is located at 92 Pebble Dr, Dunlap, TN 37327 and is currently estimated at $288,482, approximately $189 per square foot. 92 Pebble Dr is a home located in Sequatchie County with nearby schools including Griffith Elementary School, Sequatchie County Middle School, and Sequatchie County High School.
Ownership History
Date
Name
Owned For
Owner Type
Purchase Details
Closed on
Jan 26, 2022
Sold by
Sue Freeman Electa Odessji
Bought by
Land George D
Current Estimated Value
Purchase Details
Closed on
Sep 9, 1994
Bought by
Ewton Jimmy Edward and Wife Lucinda
Purchase Details
Closed on
Jan 30, 1988
Bought by
Ewton Ricky G and Wife Ruby Diane
Create a Home Valuation Report for This Property
The Home Valuation Report is an in-depth analysis detailing your home's value as well as a comparison with similar homes in the area
Home Values in the Area
Average Home Value in this Area
Purchase History
| Date | Buyer | Sale Price | Title Company |
|---|---|---|---|
| Land George D | $175,000 | None Listed On Document | |
| Ewton Jimmy Edward | $12,000 | -- | |
| Ewton Ricky G | $9,000 | -- |
Source: Public Records
Tax History
| Year | Tax Paid | Tax Assessment Tax Assessment Total Assessment is a certain percentage of the fair market value that is determined by local assessors to be the total taxable value of land and additions on the property. | Land | Improvement |
|---|---|---|---|---|
| 2025 | -- | $66,200 | $5,450 | $60,750 |
| 2024 | -- | $66,200 | $5,450 | $60,750 |
| 2023 | $1,599 | $66,200 | $5,450 | $60,750 |
| 2022 | $1,489 | $44,875 | $2,500 | $42,375 |
| 2021 | $1,467 | $44,875 | $2,500 | $42,375 |
| 2020 | $1,467 | $44,875 | $2,500 | $42,375 |
| 2019 | $1,467 | $44,875 | $2,500 | $42,375 |
| 2018 | $1,232 | $38,125 | $2,500 | $35,625 |
| 2017 | $1,218 | $38,125 | $2,500 | $35,625 |
| 2016 | $1,179 | $35,400 | $3,450 | $31,950 |
| 2015 | $1,179 | $35,400 | $3,450 | $31,950 |
| 2014 | $1,179 | $35,400 | $3,450 | $31,950 |
Source: Public Records
Map
Nearby Homes
- 79 Bear Oak Dr
- 249 Bear Oak Dr
- 157 Bear Oak Dr
- 1086 River Ridge Dr
- 1086 River Ridge Dr Unit Lot 58
- 18298 Rankin Ave
- 267 Williams Rd
- 116 Maple St
- 217 A Day Dream Dr
- 481 Tram Trail
- 1473 Old York Hwy N
- 1038 Sawmill Creek Rd
- 453 Hill Cir
- Lot 36 River Ridge Dr
- 87 Happy Valley Rd
- 563 Old Union Rd
- 0 Fredonia Loop
- 11342 Fredonia Rd
- 21 Fredonia Rd
- 3 Fredonia Rd
Your Personal Tour Guide
Ask me questions while you tour the home.