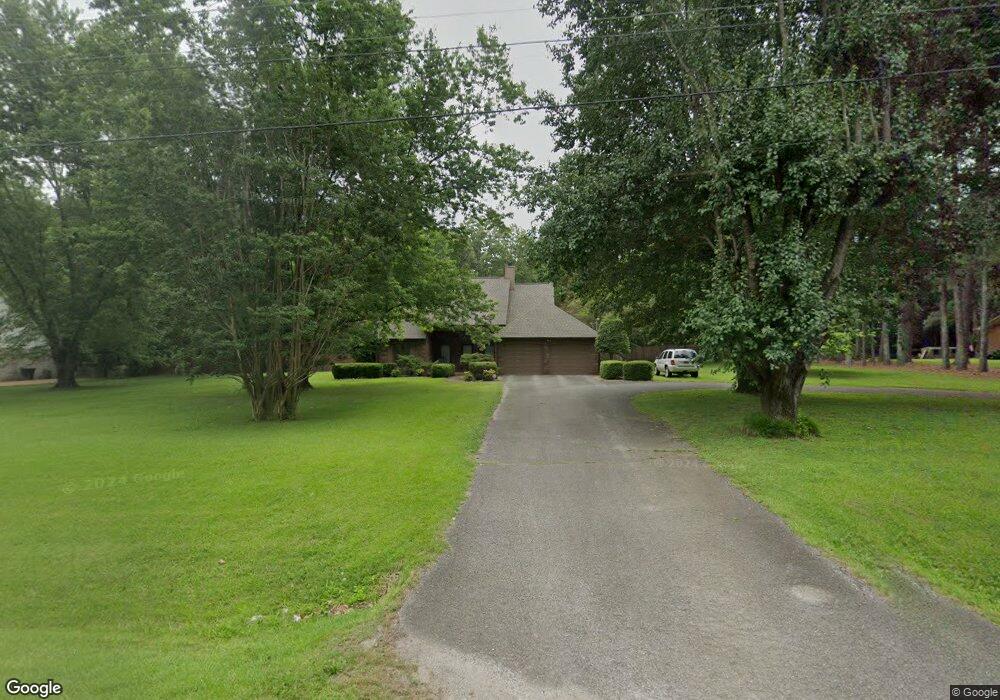
92 Pleasant Plains Rd Jackson, TN 38305
Estimated Value: $318,473 - $360,000
Studio
3
Baths
2,036
Sq Ft
$166/Sq Ft
Est. Value
About This Home
This home is located at 92 Pleasant Plains Rd, Jackson, TN 38305 and is currently estimated at $338,868, approximately $166 per square foot. 92 Pleasant Plains Rd is a home located in Madison County with nearby schools including Pope School, Northeast Middle School, and North Side High School.
Ownership History
Date
Name
Owned For
Owner Type
Purchase Details
Closed on
Aug 11, 2008
Sold by
Livingston Alan G
Bought by
Pennington William T
Current Estimated Value
Purchase Details
Closed on
Sep 1, 2004
Sold by
Becker Craig
Bought by
Livingston Alan G
Home Financials for this Owner
Home Financials are based on the most recent Mortgage that was taken out on this home.
Original Mortgage
$170,000
Interest Rate
6.01%
Purchase Details
Closed on
Jul 31, 1998
Bought by
Becker Craig
Purchase Details
Closed on
Jun 3, 1996
Sold by
Bird Darrell E
Bought by
Raines James and Raines Sherry
Purchase Details
Closed on
Aug 27, 1993
Bought by
Bird Darrell E and Bird Kakki
Purchase Details
Closed on
Feb 12, 1993
Bought by
Sanderson Aubrey
Purchase Details
Closed on
Jun 28, 1985
Bought by
Rushing William T
Create a Home Valuation Report for This Property
The Home Valuation Report is an in-depth analysis detailing your home's value as well as a comparison with similar homes in the area
Purchase History
| Date | Buyer | Sale Price | Title Company |
|---|---|---|---|
| Pennington William T | $170,000 | -- | |
| Livingston Alan G | $170,000 | -- | |
| Becker Craig | $150,000 | -- | |
| Raines James | $138,500 | -- | |
| Bird Darrell E | -- | -- | |
| Sanderson Aubrey | -- | -- | |
| Rushing William T | -- | -- |
Source: Public Records
Mortgage History
| Date | Status | Borrower | Loan Amount |
|---|---|---|---|
| Previous Owner | Rushing William T | $170,000 |
Source: Public Records
Tax History
| Year | Tax Paid | Tax Assessment Tax Assessment Total Assessment is a certain percentage of the fair market value that is determined by local assessors to be the total taxable value of land and additions on the property. | Land | Improvement |
|---|---|---|---|---|
| 2025 | $1,180 | $63,000 | $8,750 | $54,250 |
| 2024 | $1,180 | $63,000 | $8,750 | $54,250 |
| 2022 | $2,195 | $65,625 | $11,375 | $54,250 |
| 2021 | $2,116 | $49,075 | $7,500 | $41,575 |
| 2020 | $2,116 | $49,075 | $7,500 | $41,575 |
| 2019 | $2,116 | $49,075 | $7,500 | $41,575 |
| 2018 | $1,855 | $43,000 | $7,500 | $35,500 |
| 2017 | $1,829 | $41,450 | $7,500 | $33,950 |
| 2016 | $1,704 | $41,450 | $7,500 | $33,950 |
| 2015 | $1,704 | $41,450 | $7,500 | $33,950 |
| 2014 | $1,704 | $41,450 | $7,500 | $33,950 |
Source: Public Records
Map
Nearby Homes
- 50 Windfield Cove
- 812 Pipkin Rd
- 669 Walker Rd
- 292 Copper Creek Dr
- 2949 Highway 45 Bypass Frontage Rd
- 100 Crest Ridge Dr
- 148 Bridlepath Dr
- 00 Sterling Farm Dr
- 0 - A Sterling Farm Dr
- 49 Starwood Cove
- 33 Summerfield Dr
- 208 Murray Guard Dr
- 224 Murray Guard Dr
- 119 Stonehenge Dr
- 0 - N Highway 45 Bypass Frontage
- 198 Murray Guard Dr
- 221 Greenhill Dr
- 22 Deepwood Dr
- 202 Murray Guard Dr
- 178 Murray Guard Dr
- 96 Pleasant Plains Rd
- 76 Pleasant Plains Rd
- 100 Pleasant Plains Rd
- 104 Pleasant Plains Rd
- 60 Pleasant Plains Rd
- 108 Pleasant Plains Rd
- 15 Plainsfield Place
- 22 Plainsfield Place
- 112 Pleasant Plains Rd
- 50 Pleasant Plains Rd
- 109 Pleasant Plains Rd
- 116 Pleasant Plains Rd
- 603 Oil Well Rd
- 40 Plainsfield Place
- 47 Pleasant Plains Rd
- 43 Plainsfield Place
- 125 Pleasant Plains Rd
- 30 Pleasant Plains Rd
- 48 Bloomfield Cove
- 47 Windfield Cove
Your Personal Tour Guide
Ask me questions while you tour the home.