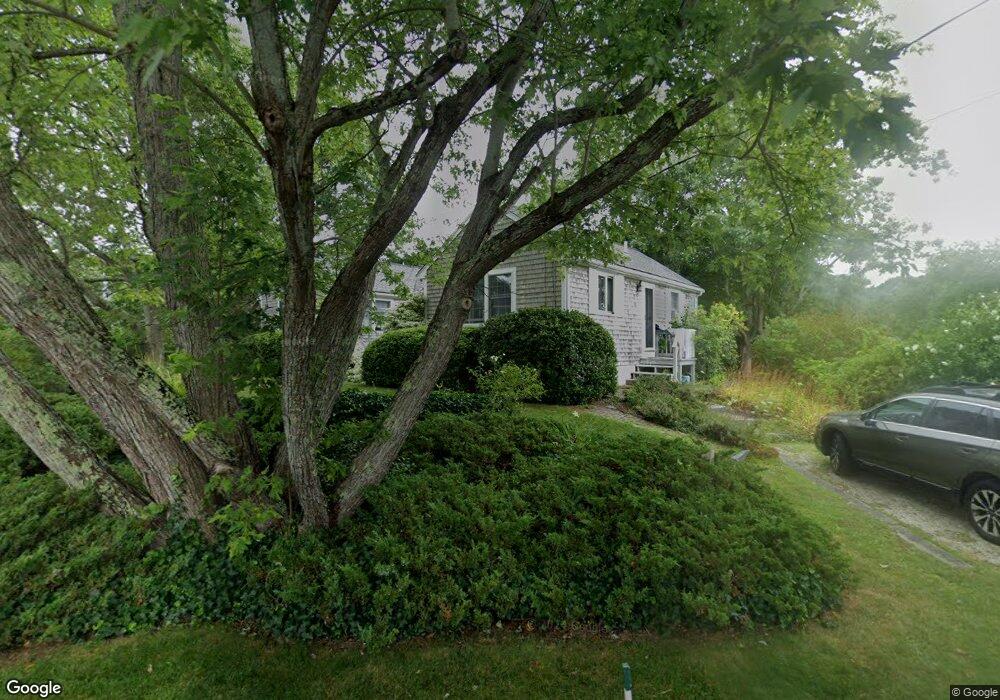
92 Tahanto Rd Pocasset, MA 02559
Pocasset NeighborhoodEstimated Value: $677,000 - $879,000
2
Beds
2
Baths
1,248
Sq Ft
$628/Sq Ft
Est. Value
About This Home
This home is located at 92 Tahanto Rd, Pocasset, MA 02559 and is currently estimated at $783,475, approximately $627 per square foot. 92 Tahanto Rd is a home located in Barnstable County with nearby schools including Bourne High School, Cadence Academy Preschool - Bourne, and St Margaret Regional School.
Ownership History
Date
Name
Owned For
Owner Type
Purchase Details
Closed on
Nov 7, 2024
Sold by
Mulligan Victoria R
Bought by
Mulligan Int and Mulligan M
Current Estimated Value
Purchase Details
Closed on
Dec 27, 1991
Sold by
Harraghy Kevin W
Bought by
Mulligan Frederick H and Mulligan Victoria R
Home Financials for this Owner
Home Financials are based on the most recent Mortgage that was taken out on this home.
Original Mortgage
$88,000
Interest Rate
8.62%
Mortgage Type
Purchase Money Mortgage
Purchase Details
Closed on
Apr 12, 1991
Sold by
Gabriel Robert J and Gabriel Judith W
Bought by
Harraghy Kevin W
Home Financials for this Owner
Home Financials are based on the most recent Mortgage that was taken out on this home.
Original Mortgage
$125,000
Interest Rate
9.32%
Mortgage Type
Purchase Money Mortgage
Create a Home Valuation Report for This Property
The Home Valuation Report is an in-depth analysis detailing your home's value as well as a comparison with similar homes in the area
Home Values in the Area
Average Home Value in this Area
Purchase History
| Date | Buyer | Sale Price | Title Company |
|---|---|---|---|
| Mulligan Int | -- | None Available | |
| Mulligan Int | -- | None Available | |
| Mulligan Int | -- | None Available | |
| Mulligan Frederick H | $163,000 | -- | |
| Harraghy Kevin W | $167,000 | -- | |
| Mulligan Frederick H | $163,000 | -- | |
| Harraghy Kevin W | $167,000 | -- |
Source: Public Records
Mortgage History
| Date | Status | Borrower | Loan Amount |
|---|---|---|---|
| Previous Owner | Harraghy Kevin W | $75,100 | |
| Previous Owner | Harraghy Kevin W | $88,000 | |
| Previous Owner | Harraghy Kevin W | $125,000 |
Source: Public Records
Tax History Compared to Growth
Tax History
| Year | Tax Paid | Tax Assessment Tax Assessment Total Assessment is a certain percentage of the fair market value that is determined by local assessors to be the total taxable value of land and additions on the property. | Land | Improvement |
|---|---|---|---|---|
| 2025 | $5,471 | $700,500 | $448,600 | $251,900 |
| 2024 | $5,374 | $670,100 | $427,200 | $242,900 |
| 2023 | $4,825 | $547,700 | $332,700 | $215,000 |
| 2022 | $4,355 | $431,600 | $261,000 | $170,600 |
| 2021 | $4,230 | $392,800 | $237,500 | $155,300 |
| 2020 | $4,116 | $383,200 | $235,300 | $147,900 |
| 2019 | $3,958 | $376,600 | $235,300 | $141,300 |
| 2018 | $3,768 | $357,500 | $229,800 | $127,700 |
| 2017 | $3,833 | $372,100 | $250,400 | $121,700 |
| 2016 | $3,521 | $346,600 | $227,700 | $118,900 |
| 2015 | $3,490 | $346,600 | $227,700 | $118,900 |
Source: Public Records
Map
Nearby Homes