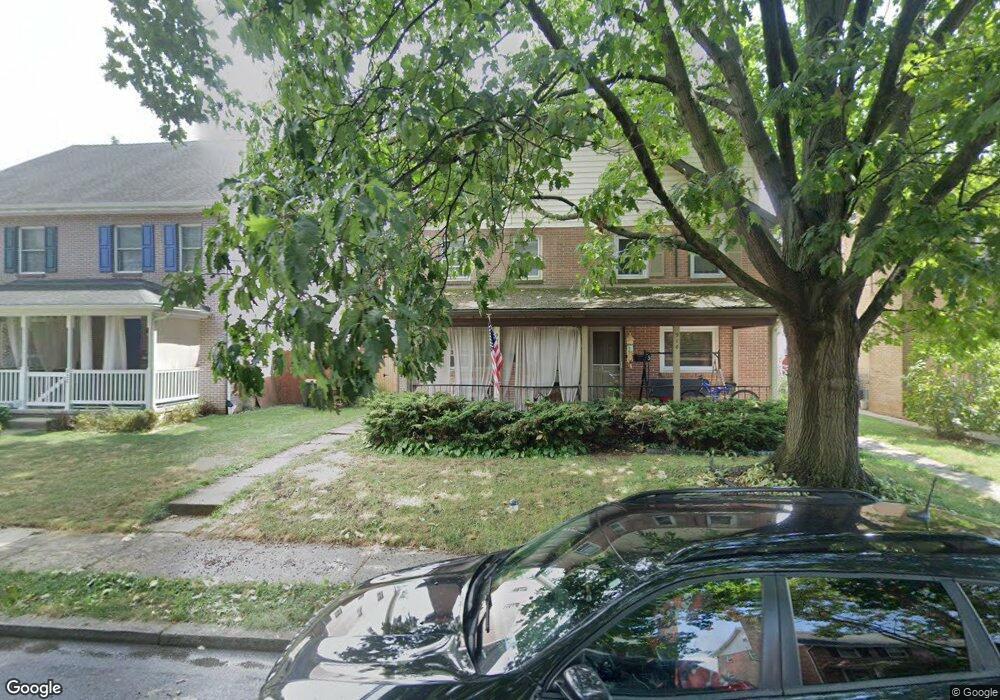
920 E Fulton St Lancaster, PA 17602
Conestoga Woods NeighborhoodEstimated Value: $197,000 - $317,555
4
Beds
2
Baths
1,683
Sq Ft
$157/Sq Ft
Est. Value
About This Home
This home is located at 920 E Fulton St, Lancaster, PA 17602 and is currently estimated at $264,389, approximately $157 per square foot. 920 E Fulton St is a home located in Lancaster County with nearby schools including Burrowes Elementary School, Wickersham Elementary School, and Lincoln Middle School.
Ownership History
Date
Name
Owned For
Owner Type
Purchase Details
Closed on
Jul 13, 2011
Sold by
Secretary Of Housing & Urban Development
Bought by
Fyock Steven
Current Estimated Value
Home Financials for this Owner
Home Financials are based on the most recent Mortgage that was taken out on this home.
Original Mortgage
$76,000
Outstanding Balance
$52,236
Interest Rate
4.49%
Mortgage Type
New Conventional
Estimated Equity
$212,153
Purchase Details
Closed on
Nov 11, 2009
Sold by
American National Bank
Bought by
The Secretary Of Housing & Urban Develop
Purchase Details
Closed on
Jul 29, 2009
Sold by
Ruiz Richard A and Ruiz Cynthia A
Bought by
American National Bank and Leader Financial Services
Purchase Details
Closed on
Nov 15, 2006
Sold by
Robbins Jon W
Bought by
Ruiz Richard A and Ruiz Cynthia A
Home Financials for this Owner
Home Financials are based on the most recent Mortgage that was taken out on this home.
Original Mortgage
$119,059
Interest Rate
6.33%
Mortgage Type
FHA
Create a Home Valuation Report for This Property
The Home Valuation Report is an in-depth analysis detailing your home's value as well as a comparison with similar homes in the area
Home Values in the Area
Average Home Value in this Area
Purchase History
| Date | Buyer | Sale Price | Title Company |
|---|---|---|---|
| Fyock Steven | $80,000 | None Available | |
| The Secretary Of Housing & Urban Develop | -- | None Available | |
| American National Bank | $4,983 | None Available | |
| Ruiz Richard A | $120,000 | None Available |
Source: Public Records
Mortgage History
| Date | Status | Borrower | Loan Amount |
|---|---|---|---|
| Open | Fyock Steven | $76,000 | |
| Previous Owner | Ruiz Richard A | $119,059 |
Source: Public Records
Tax History Compared to Growth
Tax History
| Year | Tax Paid | Tax Assessment Tax Assessment Total Assessment is a certain percentage of the fair market value that is determined by local assessors to be the total taxable value of land and additions on the property. | Land | Improvement |
|---|---|---|---|---|
| 2025 | $5,227 | $132,100 | $23,500 | $108,600 |
| 2024 | $5,227 | $132,100 | $23,500 | $108,600 |
| 2023 | $5,139 | $132,100 | $23,500 | $108,600 |
| 2022 | $4,925 | $132,100 | $23,500 | $108,600 |
| 2021 | $4,820 | $132,100 | $23,500 | $108,600 |
| 2020 | $4,820 | $132,100 | $23,500 | $108,600 |
| 2019 | $4,747 | $132,100 | $23,500 | $108,600 |
| 2018 | $2,817 | $132,100 | $23,500 | $108,600 |
| 2017 | $4,253 | $92,600 | $18,900 | $73,700 |
| 2016 | $4,214 | $92,600 | $18,900 | $73,700 |
| 2015 | $1,644 | $92,600 | $18,900 | $73,700 |
| 2014 | $3,678 | $92,600 | $18,900 | $73,700 |
Source: Public Records
Map
Nearby Homes
- 132 N Broad St
- 751 E Fulton St
- 817 E Orange St
- 742 Lehigh Ave
- 919 Clark St
- 909 E King St
- 911 E King St
- 644 E Madison St
- 623 E Chestnut St
- 609 E Chestnut St
- 610 E Madison St
- 249 N Marshall St
- 620 E King St
- 1036 E King St
- 616 New Holland Ave
- 654 New Holland Ave
- 542 E King St
- 629 E End Ave
- 53 S Marshall St
- 604 E End Ave
- 922 E Fulton St
- 918 E Fulton St
- 916 E Fulton St
- 914 E Fulton St
- 924 E Fulton St
- 921 E Chestnut St
- 1013 Grofftown Rd
- 913 E Chestnut St
- 911 E Chestnut St
- 1017 Grofftown Rd
- 921 E Fulton St
- 923 E Fulton St
- 909 E Chestnut St
- 919 E Fulton St
- 917 E Fulton St
- 925 E Fulton St
- 207 N Broad St
- 205 N Broad St
- 209 N Broad St
- 915 E Fulton St