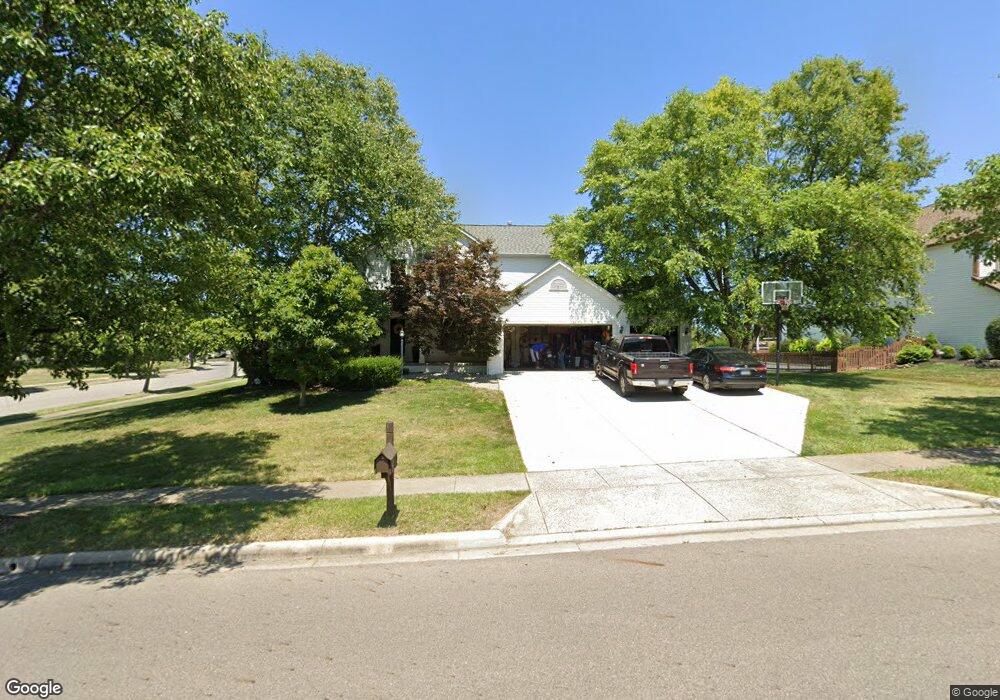
920 Gray Dr Pickerington, OH 43147
Estimated Value: $432,711 - $449,000
4
Beds
3
Baths
2,200
Sq Ft
$201/Sq Ft
Est. Value
About This Home
This home is located at 920 Gray Dr, Pickerington, OH 43147 and is currently estimated at $441,678, approximately $200 per square foot. 920 Gray Dr is a home located in Fairfield County with nearby schools including Pickerington Elementary School, Diley Middle School, and Pickerington Ridgeview Junior High School.
Ownership History
Date
Name
Owned For
Owner Type
Purchase Details
Closed on
Jan 8, 2010
Sold by
Bittinger Joseph E and Bittinger Karen M
Bought by
Harden Ervin C and Harden Danielle M
Current Estimated Value
Home Financials for this Owner
Home Financials are based on the most recent Mortgage that was taken out on this home.
Original Mortgage
$218,915
Outstanding Balance
$142,369
Interest Rate
5.16%
Mortgage Type
FHA
Estimated Equity
$299,309
Purchase Details
Closed on
Apr 17, 2002
Sold by
Boneau Robert K
Bought by
Bittinger Joseph E Karen M
Purchase Details
Closed on
Oct 16, 2001
Sold by
Dominion Homes Inc
Bought by
Boneau Robert K
Home Financials for this Owner
Home Financials are based on the most recent Mortgage that was taken out on this home.
Original Mortgage
$211,888
Interest Rate
6.99%
Mortgage Type
FHA
Create a Home Valuation Report for This Property
The Home Valuation Report is an in-depth analysis detailing your home's value as well as a comparison with similar homes in the area
Home Values in the Area
Average Home Value in this Area
Purchase History
| Date | Buyer | Sale Price | Title Company |
|---|---|---|---|
| Harden Ervin C | $223,000 | Real Living Title | |
| Bittinger Joseph E Karen M | $209,000 | -- | |
| Boneau Robert K | $213,600 | -- |
Source: Public Records
Mortgage History
| Date | Status | Borrower | Loan Amount |
|---|---|---|---|
| Open | Harden Ervin C | $218,915 | |
| Previous Owner | Boneau Robert K | $211,888 | |
| Closed | Bittinger Joseph E Karen M | -- |
Source: Public Records
Tax History
| Year | Tax Paid | Tax Assessment Tax Assessment Total Assessment is a certain percentage of the fair market value that is determined by local assessors to be the total taxable value of land and additions on the property. | Land | Improvement |
|---|---|---|---|---|
| 2025 | $15,059 | $145,100 | $43,510 | $101,590 |
| 2024 | $15,059 | $122,330 | $28,550 | $93,780 |
| 2023 | $5,908 | $122,330 | $28,550 | $93,780 |
| 2022 | $5,928 | $122,330 | $28,550 | $93,780 |
| 2021 | $5,655 | $99,330 | $27,190 | $72,140 |
| 2020 | $5,718 | $99,330 | $27,190 | $72,140 |
| 2019 | $5,753 | $99,330 | $27,190 | $72,140 |
| 2018 | $5,590 | $83,970 | $27,190 | $56,780 |
| 2017 | $5,598 | $84,070 | $27,290 | $56,780 |
| 2016 | $5,572 | $84,070 | $27,290 | $56,780 |
| 2015 | $5,310 | $75,760 | $23,730 | $52,030 |
| 2014 | $5,250 | $75,760 | $23,730 | $52,030 |
| 2013 | $5,250 | $75,760 | $23,730 | $52,030 |
Source: Public Records
Map
Nearby Homes
- 250 Sterndale Dr
- 0 Windmiller Dr
- 167 Lorrimore Dr
- 157 Lorrimore Dr
- 760 N Starr Dr
- 780 Diley Rd
- 155 Lorrimore Dr
- 149 Lorrimore Dr
- 148 Lorrimore Dr
- 213 Sterndale Dr
- 291 Sterndale Dr
- 12517 Heritage Way NW
- 287 Crestview Ln
- 140 Robinette St
- 147 Georges Creek Dr
- 113 Urich Dr
- 692 Hill Rd N
- 148 Georges Creek Dr
- 136 Pioneer Cir
- 9841 Woodsfield Cir S
Your Personal Tour Guide
Ask me questions while you tour the home.