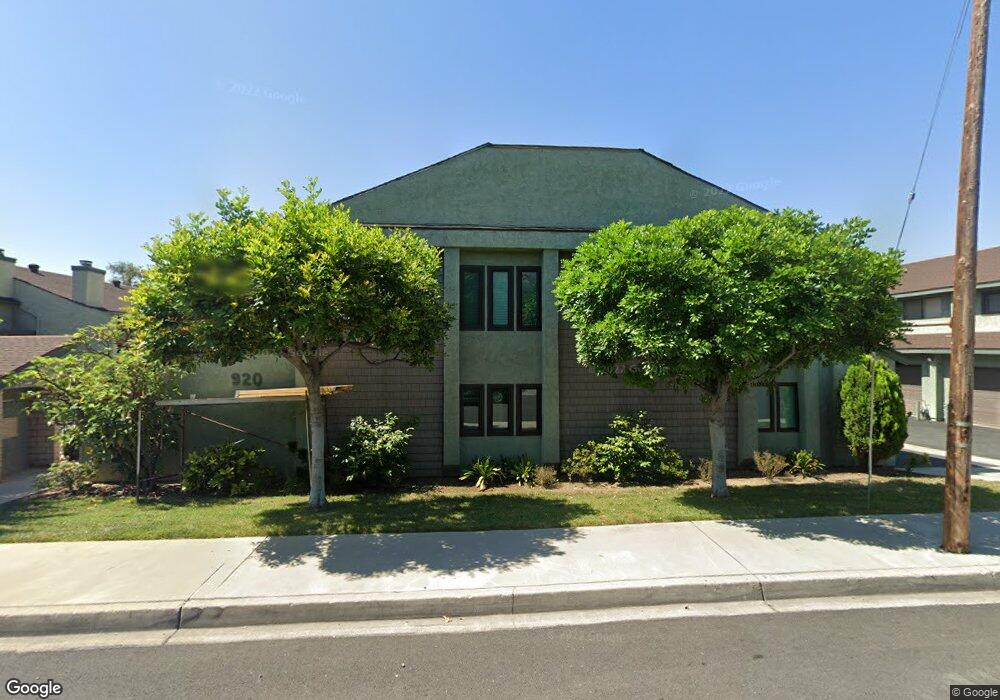
920 Ocean View Ave Unit C Monrovia, CA 91016
Estimated Value: $797,000 - $883,000
3
Beds
2
Baths
1,501
Sq Ft
$555/Sq Ft
Est. Value
About This Home
This home is located at 920 Ocean View Ave Unit C, Monrovia, CA 91016 and is currently estimated at $833,182, approximately $555 per square foot. 920 Ocean View Ave Unit C is a home located in Los Angeles County with nearby schools including Bradoaks Elementary Science Academy, Clifton Middle School, and Monrovia High School.
Ownership History
Date
Name
Owned For
Owner Type
Purchase Details
Closed on
Feb 11, 2014
Sold by
Sipple Daniel J
Bought by
Sipple Daniel John and The Daniel John Sipple Living
Current Estimated Value
Purchase Details
Closed on
Jul 18, 2003
Sold by
Gentile Michael Randolph and Gentile Michelle Nicole
Bought by
Sipple Daniel J
Home Financials for this Owner
Home Financials are based on the most recent Mortgage that was taken out on this home.
Original Mortgage
$278,000
Interest Rate
5.87%
Mortgage Type
Purchase Money Mortgage
Purchase Details
Closed on
Apr 16, 2001
Sold by
Sherman Neil and Sherman Marisa C
Bought by
Gentile Michael Randolph and Gentile Michelle Nicole
Home Financials for this Owner
Home Financials are based on the most recent Mortgage that was taken out on this home.
Original Mortgage
$172,000
Interest Rate
7.14%
Create a Home Valuation Report for This Property
The Home Valuation Report is an in-depth analysis detailing your home's value as well as a comparison with similar homes in the area
Home Values in the Area
Average Home Value in this Area
Purchase History
| Date | Buyer | Sale Price | Title Company |
|---|---|---|---|
| Sipple Daniel John | -- | None Available | |
| Sipple Daniel J | $347,500 | First American Title Co | |
| Gentile Michael Randolph | $215,000 | Lawyers Title |
Source: Public Records
Mortgage History
| Date | Status | Borrower | Loan Amount |
|---|---|---|---|
| Previous Owner | Sipple Daniel J | $278,000 | |
| Previous Owner | Gentile Michael Randolph | $172,000 | |
| Closed | Sipple Daniel J | $34,750 |
Source: Public Records
Tax History
| Year | Tax Paid | Tax Assessment Tax Assessment Total Assessment is a certain percentage of the fair market value that is determined by local assessors to be the total taxable value of land and additions on the property. | Land | Improvement |
|---|---|---|---|---|
| 2025 | $6,640 | $494,054 | $301,978 | $192,076 |
| 2024 | $6,640 | $484,367 | $296,057 | $188,310 |
| 2023 | $6,487 | $474,870 | $290,252 | $184,618 |
| 2022 | $6,298 | $465,560 | $284,561 | $180,999 |
| 2021 | $6,171 | $456,432 | $278,982 | $177,450 |
| 2019 | $5,877 | $442,896 | $270,708 | $172,188 |
| 2018 | $5,736 | $434,212 | $265,400 | $168,812 |
| 2016 | $5,509 | $417,353 | $255,096 | $162,257 |
| 2015 | $5,388 | $411,085 | $251,265 | $159,820 |
| 2014 | $5,333 | $403,034 | $246,344 | $156,690 |
Source: Public Records
Map
Nearby Homes
- 930 Ocean View Ave Unit E
- 136 Madeline Dr
- 115 N Mountain Ave Unit A
- 835 E Foothill Blvd
- 108 S Mountain Ave Unit A
- 824 Ocean View Ave
- 223 N Mountain Ave
- 61 Palm Hill Ln
- 100 Palm Hill Ln
- 188 Deodar Ln
- 248 Poppy Ave
- 201 Deodar Ln
- 408 Meadow Ln
- 424 E Foothill Blvd
- 549 Norumbega Dr
- 520 E Lime Ave
- 785 Norumbega Dr
- 149 Grand Ave
- 603 Park Rose Ave
- 257 Aspen Dr
- 120 N Mountain Ave Unit A
- 920 Ocean View Ave Unit A
- 920 Ocean View Ave Unit B
- 920 Ocean View Ave Unit D
- 920 Ocean View Ave Unit E
- 930 Ocean View Ave Unit D
- 930 Ocean View Ave Unit C
- 930 Ocean View Ave Unit B
- 930 Ocean View Ave Unit A
- 910 Ocean View Ave Unit E
- 910 Ocean View Ave Unit D
- 910 Ocean View Ave Unit C
- 910 Ocean View Ave Unit B
- 910 Ocean View Ave Unit A
- 120 S Mountain Ave Unit A
- 921 Ocean View Ave
- 915 Ocean View Ave
- 136 Madeline Dr
- 925 Ocean View Ave
- 911 Ocean View Ave
Your Personal Tour Guide
Ask me questions while you tour the home.