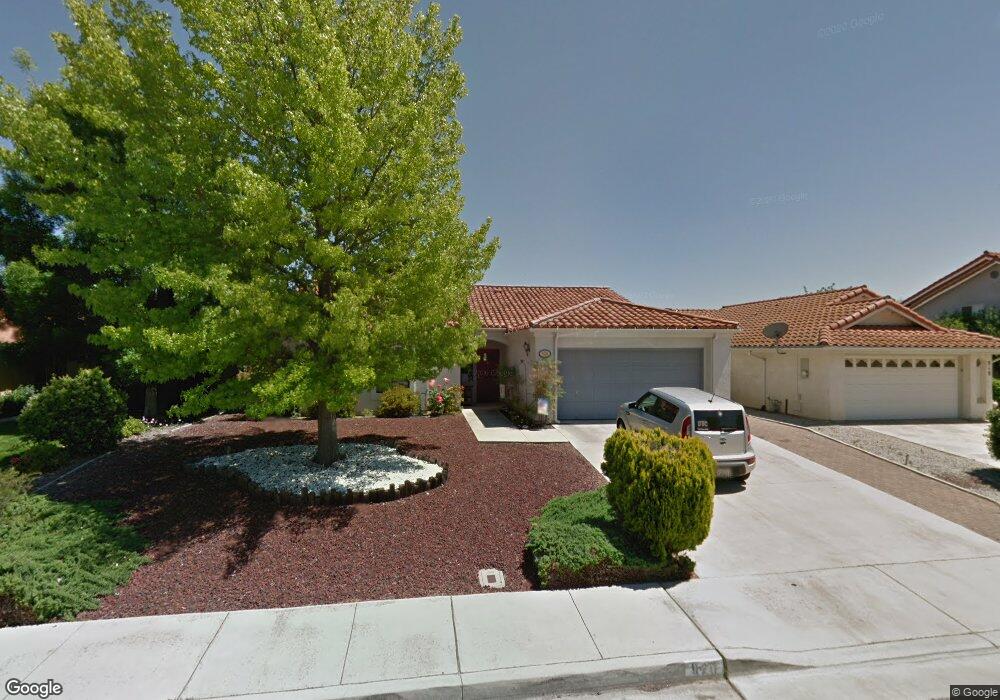
920 Torrey Pines Dr Paso Robles, CA 93446
Estimated Value: $670,000 - $794,000
3
Beds
2
Baths
1,901
Sq Ft
$385/Sq Ft
Est. Value
About This Home
This home is located at 920 Torrey Pines Dr, Paso Robles, CA 93446 and is currently estimated at $732,800, approximately $385 per square foot. 920 Torrey Pines Dr is a home located in San Luis Obispo County with nearby schools including Pat Butler Elementary School, George H. Flamson Middle School, and Paso Robles High School.
Ownership History
Date
Name
Owned For
Owner Type
Purchase Details
Closed on
Oct 26, 2010
Sold by
Brown Thomas E
Bought by
Brown Thomas E and Thomas E Brown Revocable Trust
Current Estimated Value
Purchase Details
Closed on
Jun 17, 2008
Sold by
Peterson Neil Clayton
Bought by
Brown Thomas E
Home Financials for this Owner
Home Financials are based on the most recent Mortgage that was taken out on this home.
Original Mortgage
$261,750
Outstanding Balance
$167,448
Interest Rate
5.99%
Mortgage Type
Purchase Money Mortgage
Estimated Equity
$565,352
Purchase Details
Closed on
Feb 12, 2004
Sold by
Peterson Joy and Danielson Revocable Trust
Bought by
Peterson Niel Clayton and Peterson Joy
Purchase Details
Closed on
Mar 10, 1998
Sold by
Danielson Ray Otto
Bought by
Adkins Danielson Lavon F
Purchase Details
Closed on
Dec 25, 1997
Sold by
Danielson Ray O
Bought by
Danielson Ray O and Danielson Revocable Trust
Create a Home Valuation Report for This Property
The Home Valuation Report is an in-depth analysis detailing your home's value as well as a comparison with similar homes in the area
Purchase History
| Date | Buyer | Sale Price | Title Company |
|---|---|---|---|
| Brown Thomas E | -- | None Available | |
| Brown Thomas E | $355,000 | First American Title Co | |
| Peterson Niel Clayton | -- | -- | |
| Adkins Danielson Lavon F | -- | Cuesta Title | |
| Danielson Ray O | -- | -- |
Source: Public Records
Mortgage History
| Date | Status | Borrower | Loan Amount |
|---|---|---|---|
| Open | Brown Thomas E | $261,750 |
Source: Public Records
Tax History
| Year | Tax Paid | Tax Assessment Tax Assessment Total Assessment is a certain percentage of the fair market value that is determined by local assessors to be the total taxable value of land and additions on the property. | Land | Improvement |
|---|---|---|---|---|
| 2025 | $5,082 | $466,281 | $183,882 | $282,399 |
| 2024 | $4,999 | $457,139 | $180,277 | $276,862 |
| 2023 | $4,999 | $448,177 | $176,743 | $271,434 |
| 2022 | $4,925 | $439,390 | $173,278 | $266,112 |
| 2021 | $4,841 | $430,776 | $169,881 | $260,895 |
| 2020 | $4,775 | $426,360 | $168,140 | $258,220 |
| 2019 | $4,707 | $418,001 | $164,844 | $253,157 |
| 2018 | $4,643 | $409,806 | $161,612 | $248,194 |
| 2017 | $4,366 | $401,772 | $158,444 | $243,328 |
| 2016 | $4,281 | $393,895 | $155,338 | $238,557 |
| 2015 | $4,265 | $387,979 | $153,005 | $234,974 |
| 2014 | $4,116 | $380,380 | $150,008 | $230,372 |
Source: Public Records
Map
Nearby Homes
- 911 Saint Ann Dr
- 907 Saint Ann Dr
- 1006 Eagle Ct
- 834 Nicklaus St
- 1736 Wade Dr
- 795 Angus St
- 829 Saint Andrews Cir
- 912 Wade Dr
- 1635 Wade Dr
- 17 Green Ct
- 1165 Mazzini Rd
- 1166 Mazzini Rd
- 1160 Mazzini Rd
- 940 Austin Ct
- 1309 Stoney Creek Rd
- 1036 Samantha Dr
- 470 Kenton Ct
- 358 Via Ramona
- 204 Nighthawk Dr
- 250 Santa Bella
- 918 Torrey Pines Dr
- 922 Torrey Pines Dr
- 916 Torrey Pines Dr
- 924 Torrey Pines Dr
- 919 Torrey Pines Dr
- 921 Torrey Pines Dr
- 917 Torrey Pines Dr
- 923 Torrey Pines Dr
- 914 Torrey Pines Dr
- 926 Torrey Pines Dr
- 915 Torrey Pines Dr
- 925 Torrey Pines Dr
- 912 Torrey Pines Dr
- 913 Torrey Pines Dr
- 928 Torrey Pines Dr
- 927 Torrey Pines Dr
- 911 Torrey Pines Dr
- 910 Torrey Pines Dr
- 930 Torrey Pines Dr
- 929 Torrey Pines Dr
Your Personal Tour Guide
Ask me questions while you tour the home.