Estimated Value: $512,292 - $540,000
5
Beds
4
Baths
2,116
Sq Ft
$249/Sq Ft
Est. Value
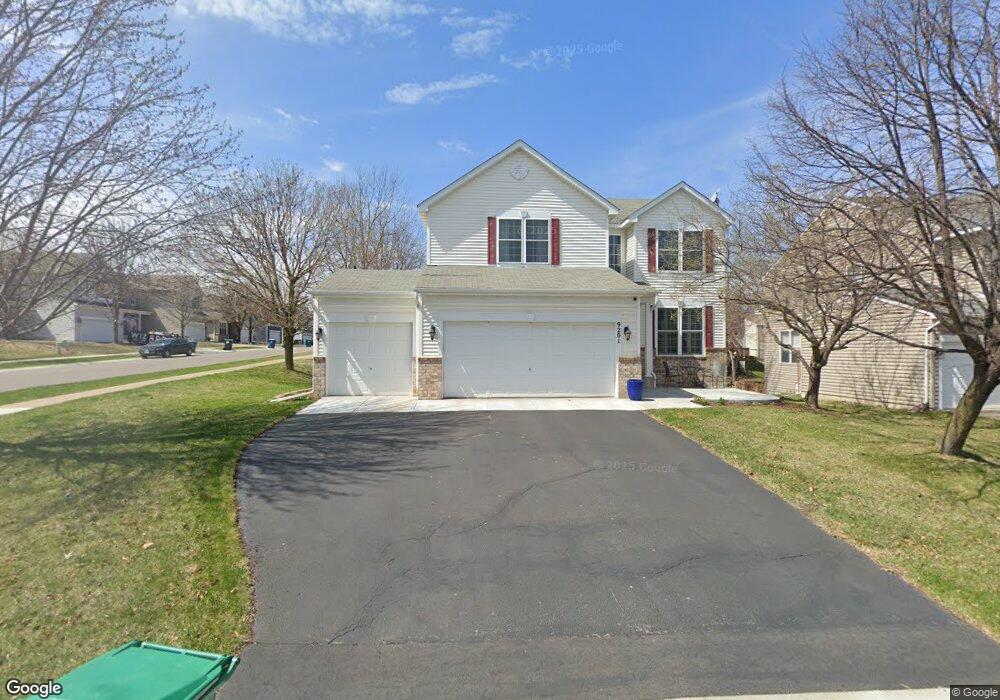
About This Home
This home is located at 9201 Olive Ln N, Osseo, MN 55311 and is currently estimated at $527,823, approximately $249 per square foot. 9201 Olive Ln N is a home located in Hennepin County with nearby schools including Rush Creek Elementary School, Maple Grove Middle School, and Maple Grove Senior High School.
Ownership History
Date
Name
Owned For
Owner Type
Purchase Details
Closed on
Jul 31, 2019
Sold by
Ruffalo Bryant J and Ruffalo Jenny L
Bought by
Shrestha Nirajan and Shrestha Rini
Current Estimated Value
Home Financials for this Owner
Home Financials are based on the most recent Mortgage that was taken out on this home.
Original Mortgage
$368,910
Outstanding Balance
$323,296
Interest Rate
3.73%
Mortgage Type
New Conventional
Estimated Equity
$204,527
Purchase Details
Closed on
Aug 13, 2015
Sold by
Kruper Laureen Kay and Kruper Patrick W
Bought by
Ruffallo Bryant J and Ruffalo Jenny L
Home Financials for this Owner
Home Financials are based on the most recent Mortgage that was taken out on this home.
Original Mortgage
$332,500
Interest Rate
3.87%
Mortgage Type
New Conventional
Purchase Details
Closed on
Mar 17, 2000
Sold by
Ryland Homes
Bought by
Grothaus Charles E and Grothaus Laureen K
Create a Home Valuation Report for This Property
The Home Valuation Report is an in-depth analysis detailing your home's value as well as a comparison with similar homes in the area
Home Values in the Area
Average Home Value in this Area
Purchase History
| Date | Buyer | Sale Price | Title Company |
|---|---|---|---|
| Shrestha Nirajan | $409,900 | Liberty Title Inc | |
| Ruffallo Bryant J | $350,000 | All American Title Company | |
| Grothaus Charles E | $217,400 | -- |
Source: Public Records
Mortgage History
| Date | Status | Borrower | Loan Amount |
|---|---|---|---|
| Open | Shrestha Nirajan | $368,910 | |
| Previous Owner | Ruffallo Bryant J | $332,500 |
Source: Public Records
Tax History Compared to Growth
Tax History
| Year | Tax Paid | Tax Assessment Tax Assessment Total Assessment is a certain percentage of the fair market value that is determined by local assessors to be the total taxable value of land and additions on the property. | Land | Improvement |
|---|---|---|---|---|
| 2024 | $6,413 | $480,600 | $110,300 | $370,300 |
| 2023 | $6,106 | $469,400 | $105,700 | $363,700 |
| 2022 | $4,538 | $457,500 | $86,100 | $371,400 |
| 2021 | $4,383 | $376,600 | $62,900 | $313,700 |
| 2020 | $4,564 | $359,100 | $52,900 | $306,200 |
| 2019 | $4,702 | $355,400 | $63,500 | $291,900 |
| 2018 | $4,626 | $346,300 | $73,900 | $272,400 |
| 2017 | $4,687 | $326,400 | $78,000 | $248,400 |
| 2016 | $4,464 | $308,200 | $68,000 | $240,200 |
| 2015 | $4,740 | $317,400 | $80,000 | $237,400 |
| 2014 | -- | $284,500 | $69,000 | $215,500 |
Source: Public Records
Map
Nearby Homes
- 9125 Olive Ln N
- 9260 Merrimac Ln N
- 18053 90th Place N
- 17475 90th Ave N
- 17913 96th Ave N
- 10145 Peony Ln N
- 10154 Peony Ln N
- 18244 88th Place N
- 17198 93rd Place N Unit 62
- 17868 96th Ave N
- 9440 Jewel Ln N
- 9433 Jewel Ln N
- 9601 Olive Ln N
- 9365 Tewsbury Bend
- 9245 Holly Ln N Unit 704
- 9477 Jewel Ln N
- 18244 87th Place N
- 9363 Tewsbury Gate N
- 8688 Vagabond Ln N
- 9150 Comstock Ln N
- 9213 Olive Ln N
- 9199 Olive Ln N
- 9225 Olive Ln N
- 9208 Peony Ln N
- 17887 17887 92nd-Avenue-n
- 9200 Olive Ln N
- 17875 92nd Ave N
- 9216 Peony Ln N
- 9212 Olive Ln N
- 9231 Olive Ln N
- 17887 92nd Ave N
- 9191 Olive Ln N
- 9224 Olive Ln N
- 9198 Olive Ln N
- 9224 Peony Ln N
- 17909 92nd Ave N
- 9236 Olive Ln N
- 9186 Olive Ln N
- 9237 Olive Ln N
- 9201 Peony Ln N