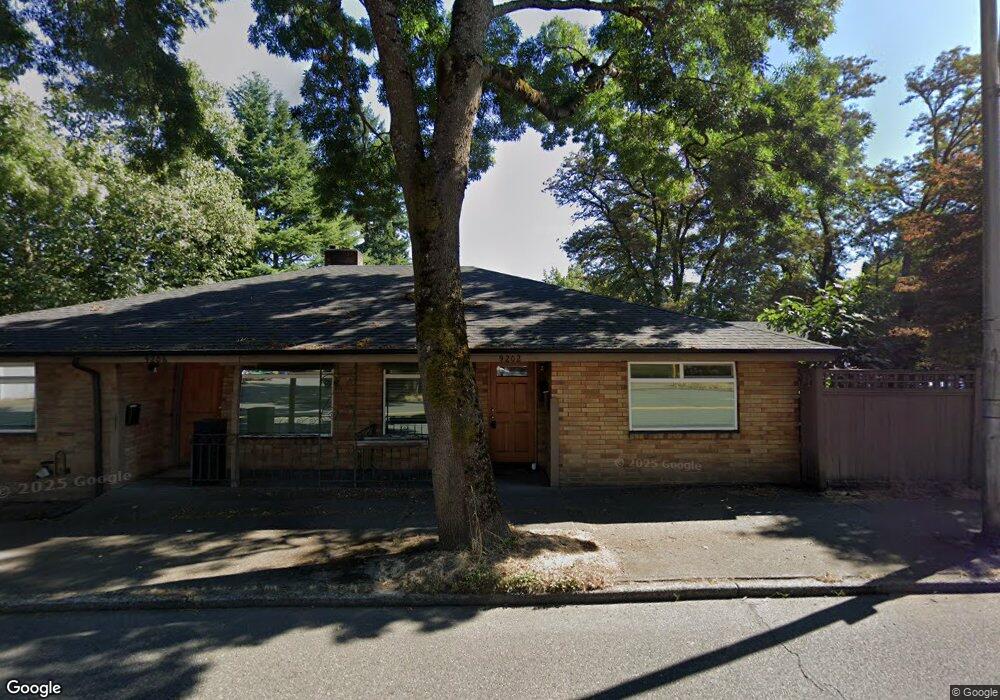
9202 35th Ave NE Unit Lower Seattle, WA 98115
Wedgwood NeighborhoodEstimated Value: $970,000 - $1,234,109
2
Beds
1
Bath
1,850
Sq Ft
$591/Sq Ft
Est. Value
About This Home
This home is located at 9202 35th Ave NE Unit Lower, Seattle, WA 98115 and is currently estimated at $1,093,527, approximately $591 per square foot. 9202 35th Ave NE Unit Lower is a home located in King County with nearby schools including View Ridge Elementary School, Eckstein Middle School, and Nathan Hale High School.
Ownership History
Date
Name
Owned For
Owner Type
Purchase Details
Closed on
Aug 5, 2020
Sold by
Nemitz Jeffrey J
Bought by
Jj Plex Llc
Current Estimated Value
Purchase Details
Closed on
Mar 26, 2020
Sold by
Jj Plex Llc
Bought by
Nemitz Jeffrey J
Home Financials for this Owner
Home Financials are based on the most recent Mortgage that was taken out on this home.
Original Mortgage
$371,000
Interest Rate
3.4%
Mortgage Type
New Conventional
Purchase Details
Closed on
Aug 17, 2015
Sold by
Olsby George A
Bought by
Nemitz Jeffrey J
Purchase Details
Closed on
Nov 1, 1993
Sold by
Olsby Clifford W and Olsby Ilene
Bought by
Olsby Ilene
Purchase Details
Closed on
Apr 2, 1992
Sold by
Hedstrom Donald
Bought by
Olsby Clifford W and Olsby Ilene
Purchase Details
Closed on
Nov 17, 1982
Sold by
Hedstrom Rosemary H and Hedstrom Donald J
Bought by
Olsey Clifford W and Olsby Ilene
Create a Home Valuation Report for This Property
The Home Valuation Report is an in-depth analysis detailing your home's value as well as a comparison with similar homes in the area
Home Values in the Area
Average Home Value in this Area
Purchase History
| Date | Buyer | Sale Price | Title Company |
|---|---|---|---|
| Jj Plex Llc | -- | None Available | |
| Nemitz Jeffrey J | -- | Wfg Natl Ttl Co Of Wa Llc | |
| Nemitz Jeffrey J | $567,000 | Rainier Title | |
| Olsby Ilene | -- | -- | |
| Olsby Clifford W | -- | Stewart Title Company | |
| Olsey Clifford W | -- | First American Title Ins Co |
Source: Public Records
Mortgage History
| Date | Status | Borrower | Loan Amount |
|---|---|---|---|
| Previous Owner | Nemitz Jeffrey J | $371,000 |
Source: Public Records
Tax History Compared to Growth
Tax History
| Year | Tax Paid | Tax Assessment Tax Assessment Total Assessment is a certain percentage of the fair market value that is determined by local assessors to be the total taxable value of land and additions on the property. | Land | Improvement |
|---|---|---|---|---|
| 2024 | $10,466 | $1,063,000 | $512,000 | $551,000 |
| 2023 | $9,241 | $940,000 | $478,000 | $462,000 |
| 2022 | $8,862 | $1,111,000 | $532,000 | $579,000 |
| 2021 | $8,066 | $930,000 | $454,000 | $476,000 |
| 2020 | $7,802 | $800,000 | $375,000 | $425,000 |
| 2018 | $6,891 | $735,000 | $301,000 | $434,000 |
| 2017 | $6,225 | $669,000 | $274,000 | $395,000 |
| 2016 | $5,791 | $625,000 | $256,000 | $369,000 |
| 2015 | $5,102 | $568,000 | $233,000 | $335,000 |
| 2014 | -- | $511,000 | $210,000 | $301,000 |
| 2013 | -- | $431,000 | $208,000 | $223,000 |
Source: Public Records
Map
Nearby Homes
- 3521 NE 92nd St
- 3537 NE 93rd St
- 9400 35th Ave NE
- 3510 NE 90th St
- 9120 38th Ave NE
- 9517 35th Ave NE Unit 2A
- 3814 NE 89th St
- 3816 NE 89th St
- 3807 NE 89th St
- 3811 NE 89th St
- 3809 NE 89th St
- 3815 NE 89th St
- 3849 NE 95th St
- 3539 NE 88th St Unit A
- 8701 35th Ave NE Unit 9
- 3038 NE 95th St
- 3847 NE 88th St
- 3849 NE 88th St
- 2718 NE 90th St
- 2704 NE 92nd St
- 9202 35th Ave NE
- 9202 35th Ave NE Unit Upper
- 9202 -9206 35th Ave NE
- 9206 35th Ave NE
- 3506 NE 92nd St
- 9216 35th Ave NE
- 3507 NE 93rd St
- 9125 35th Ave NE
- 9117 35th Ave NE
- 3515 NE 93rd St
- 9201 35th Ave NE
- 9115 35th Ave NE
- 9115 35th Ave NE
- 3520 NE 92nd St
- 3511 NE 92nd St
- 3251 NE 92nd St
- 3521 NE 93rd St
- 9209 35th Ave NE
- 3517 NE 92nd St
- 3524 NE 92nd St