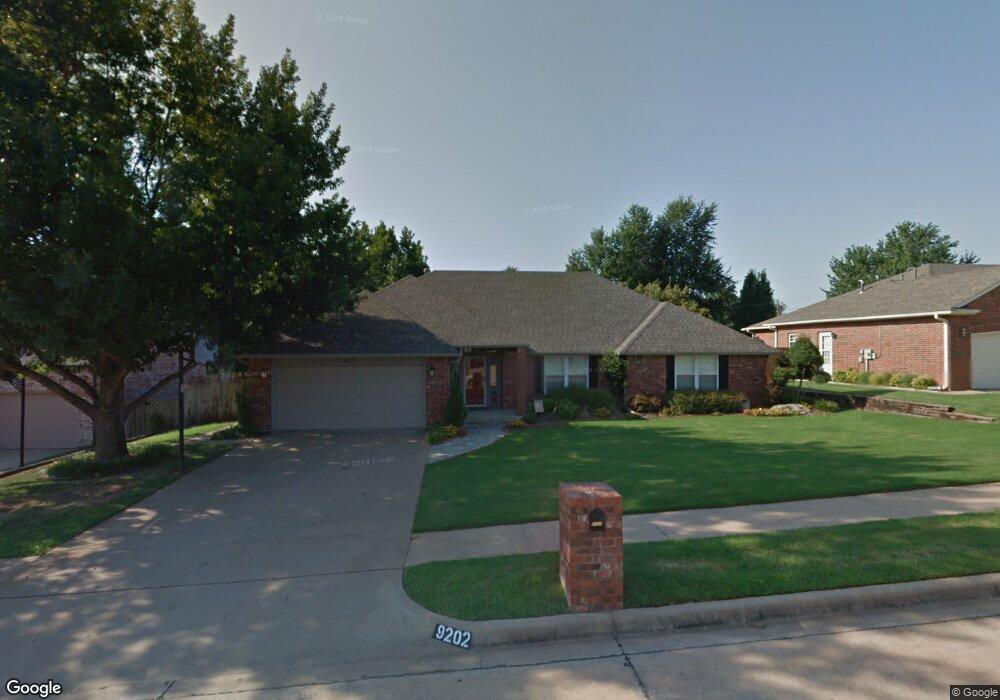
9202 E 113th St S Bixby, OK 74008
North Bixby NeighborhoodEstimated Value: $325,571 - $366,000
4
Beds
3
Baths
2,112
Sq Ft
$161/Sq Ft
Est. Value
About This Home
This home is located at 9202 E 113th St S, Bixby, OK 74008 and is currently estimated at $339,643, approximately $160 per square foot. 9202 E 113th St S is a home located in Tulsa County with nearby schools including Bixby North Elementary, Bixby North Intermediate, and Bixby Middle School.
Ownership History
Date
Name
Owned For
Owner Type
Purchase Details
Closed on
Jan 25, 2024
Sold by
Boyken Marshall S and Boyken Miya M
Bought by
Marshall And Miya Boyken Family Trust and Boyken
Current Estimated Value
Purchase Details
Closed on
Jun 25, 2009
Sold by
Hayes Robert W and Hayes Shawna D
Bought by
Boyken Marshall S and Boyken Miya M
Purchase Details
Closed on
Jul 28, 2000
Sold by
Mongrain Robert B and Mongrain Darlene D
Bought by
Hayes Robert W and Hayes Shawna D
Home Financials for this Owner
Home Financials are based on the most recent Mortgage that was taken out on this home.
Original Mortgage
$136,000
Interest Rate
8.15%
Mortgage Type
Purchase Money Mortgage
Purchase Details
Closed on
Aug 22, 1997
Sold by
Mongrain Robert B and Mongrain Darlene D
Bought by
Mongrain Robert B and Mongrain Darlene D
Purchase Details
Closed on
Nov 1, 1993
Purchase Details
Closed on
Oct 1, 1991
Create a Home Valuation Report for This Property
The Home Valuation Report is an in-depth analysis detailing your home's value as well as a comparison with similar homes in the area
Home Values in the Area
Average Home Value in this Area
Purchase History
| Date | Buyer | Sale Price | Title Company |
|---|---|---|---|
| Marshall And Miya Boyken Family Trust | -- | None Listed On Document | |
| Boyken Marshall S | $216,000 | Executives Title & Escrow Co | |
| Hayes Robert W | $170,000 | Delta Title & Escrow | |
| Mongrain Robert B | -- | Guaranty Abstract Company | |
| -- | $111,500 | -- | |
| -- | $101,500 | -- |
Source: Public Records
Mortgage History
| Date | Status | Borrower | Loan Amount |
|---|---|---|---|
| Previous Owner | Hayes Robert W | $136,000 |
Source: Public Records
Tax History
| Year | Tax Paid | Tax Assessment Tax Assessment Total Assessment is a certain percentage of the fair market value that is determined by local assessors to be the total taxable value of land and additions on the property. | Land | Improvement |
|---|---|---|---|---|
| 2025 | $3,424 | $24,963 | $2,396 | $22,567 |
| 2024 | $3,284 | $24,207 | $2,114 | $22,093 |
| 2023 | $3,284 | $24,472 | $2,559 | $21,913 |
| 2022 | $3,198 | $22,760 | $3,309 | $19,451 |
| 2021 | $2,989 | $22,760 | $3,309 | $19,451 |
| 2020 | $3,008 | $22,760 | $3,309 | $19,451 |
| 2019 | $3,019 | $22,760 | $3,309 | $19,451 |
| 2018 | $2,991 | $22,760 | $3,309 | $19,451 |
| 2017 | $2,972 | $23,760 | $3,454 | $20,306 |
| 2016 | $2,936 | $23,760 | $3,454 | $20,306 |
| 2015 | $2,808 | $23,760 | $3,454 | $20,306 |
| 2014 | $2,804 | $23,760 | $3,454 | $20,306 |
Source: Public Records
Map
Nearby Homes
- 9430 E 115th St S
- 8969 E 116th St S
- 9539 E 109th St S
- 9528 E 117th St S
- 9705 E 116th Place S
- 11713 S 96th East Place
- 10848 S 95th East Ave
- 4713 S Retana Ave
- 4705 S Retana Ave
- 8702 E 110th Ct
- 8812 E 110th St
- 9745 E 116th Place S
- 4601 S Sequoia Ave
- 10905 S 89th East Ave
- 4607 S Retana Place
- 13154 S 100th East Ave
- 9632 E 118th Place S
- 10221 E 114th Place S
- 4529 S Retana Ave
- 6101 W Birmingham Cir
- 9200 E 113th St S
- 9300 E 113th St S
- 9302 E 113th St S
- 11214 S 93rd East Ave
- 9141 E 114th St S
- 9135 E 114th St S
- 9307 E 113th St S
- 9304 E 113th St S
- 9145 E 114th St S
- 11212 S 93rd East Ave
- 11213 S 93rd East Ave
- 9131 E 114th St S
- 11216 S 94th East Ave
- 9400 E 113th St S
- 11211 S 93rd Ave E
- 9102 E 113th St S
- 11211 S 93rd East Ave
- 13418 S 94th Ave E
- 11210 S 93rd East Ave
- 9148 E 114th St S
Your Personal Tour Guide
Ask me questions while you tour the home.