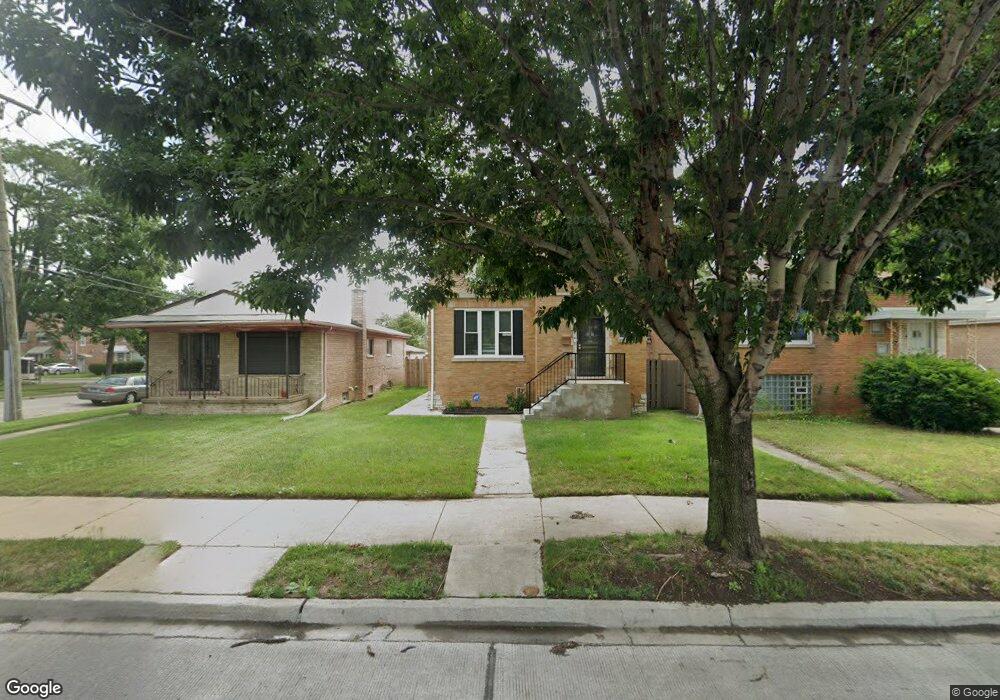
9203 S State St Chicago, IL 60619
Chatham NeighborhoodEstimated Value: $307,000 - $365,069
3
Beds
2
Baths
1,517
Sq Ft
$226/Sq Ft
Est. Value
About This Home
This home is located at 9203 S State St, Chicago, IL 60619 and is currently estimated at $343,267, approximately $226 per square foot. 9203 S State St is a home located in Cook County with nearby schools including Gillespie Elementary School, Harlan Community Academy High School, and Christian S T E M Scholars.
Ownership History
Date
Name
Owned For
Owner Type
Purchase Details
Closed on
Jan 23, 2025
Sold by
C Ivy Flips Llc
Bought by
Moore Lynni
Current Estimated Value
Home Financials for this Owner
Home Financials are based on the most recent Mortgage that was taken out on this home.
Original Mortgage
$328,932
Outstanding Balance
$326,554
Interest Rate
6.6%
Mortgage Type
New Conventional
Estimated Equity
$16,713
Purchase Details
Closed on
Jan 24, 2023
Sold by
Tl6 Il3 Llc
Bought by
C Ivy Flips Llc
Purchase Details
Closed on
Dec 22, 2022
Sold by
Yarbrough Karen A
Bought by
Tl6 Il3 Llc
Purchase Details
Closed on
Jul 1, 2009
Sold by
Green William
Bought by
Jones Will
Purchase Details
Closed on
Jan 8, 2009
Sold by
Ham Forice C and Wiks Yvette B
Bought by
United States Receivers Caretakers Assn
Purchase Details
Closed on
Jan 20, 2004
Sold by
Wilks Yvette B
Bought by
Wilks Yvette B and Ham Forice C
Create a Home Valuation Report for This Property
The Home Valuation Report is an in-depth analysis detailing your home's value as well as a comparison with similar homes in the area
Home Values in the Area
Average Home Value in this Area
Purchase History
| Date | Buyer | Sale Price | Title Company |
|---|---|---|---|
| Moore Lynni | $335,000 | Fidelity National Title | |
| C Ivy Flips Llc | $61,000 | Chicago Title | |
| Tl6 Il3 Llc | -- | None Listed On Document | |
| Tl6 Il3 Llc | -- | -- | |
| Jones Will | $7,000 | None Available | |
| United States Receivers Caretakers Assn | -- | None Available | |
| Richardson Tammy | -- | None Available | |
| Wilks Yvette B | -- | Torrens Titles | |
| Wilks Yvette B | -- | -- |
Source: Public Records
Mortgage History
| Date | Status | Borrower | Loan Amount |
|---|---|---|---|
| Open | Moore Lynni | $328,932 |
Source: Public Records
Tax History Compared to Growth
Tax History
| Year | Tax Paid | Tax Assessment Tax Assessment Total Assessment is a certain percentage of the fair market value that is determined by local assessors to be the total taxable value of land and additions on the property. | Land | Improvement |
|---|---|---|---|---|
| 2024 | $2,538 | $10,800 | $3,290 | $7,510 |
| 2023 | $2,476 | $12,000 | $4,387 | $7,613 |
| 2022 | $2,476 | $12,000 | $4,387 | $7,613 |
| 2021 | $2,420 | $12,000 | $4,387 | $7,613 |
| 2020 | $3,300 | $14,779 | $3,509 | $11,270 |
| 2019 | $3,272 | $16,241 | $3,509 | $12,732 |
| 2018 | $3,216 | $16,241 | $3,509 | $12,732 |
| 2017 | $3,629 | $16,823 | $3,070 | $13,753 |
| 2016 | $3,377 | $16,823 | $3,070 | $13,753 |
| 2015 | $3,090 | $16,823 | $3,070 | $13,753 |
| 2014 | $2,743 | $14,749 | $2,632 | $12,117 |
| 2013 | $2,689 | $14,749 | $2,632 | $12,117 |
Source: Public Records
Map
Nearby Homes
- 9151 S Perry Ave
- 9246 S Perry Ave
- 9314 S Perry Ave
- 237 E 92nd St
- 9329 S Wentworth Ave
- 254 E 92nd St Unit 1
- 9150 S Burnside Ave
- 39 E 89th St
- 9437 S Indiana Ave
- 9413 S Prairie Ave
- 9521 S La Salle St
- 312 E 90th St
- 9220 S King Dr
- 9400 S Calumet Ave
- 9553 S Perry Ave
- 9326 S King Dr
- 9422 S Calumet Ave
- 9528 S Prairie Ave
- 9601 S Perry Ave
- 9456 S Calumet Ave
- 9209 S State St
- 9201 S State St
- 9211 S State St
- 9215 S State St
- 9215 S State St
- 9166 S Urban Ave
- 19 E 92nd St
- 9217 S State St
- 9164 S Urban Ave
- 9223 S State St
- 9160 S Urban Ave
- 9155 S Urban Ave
- 9158 S Urban Ave
- 9212 S Wabash Ave
- 9153 S Urban Ave
- 9204 S Wabash Ave
- 9227 S State St
- 9200 S Wabash Ave
- 9216 S Wabash Ave
- 9149 S Urban Ave