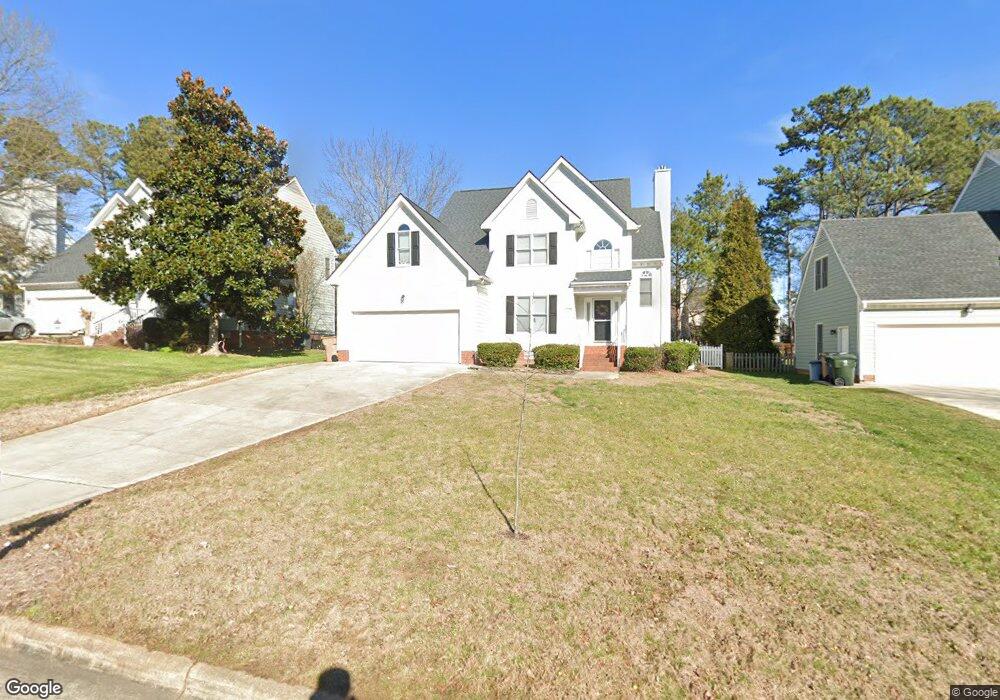
9204 Dawnshire Rd Raleigh, NC 27615
Durant NeighborhoodEstimated Value: $487,461 - $539,000
4
Beds
3
Baths
2,123
Sq Ft
$240/Sq Ft
Est. Value
About This Home
This home is located at 9204 Dawnshire Rd, Raleigh, NC 27615 and is currently estimated at $509,865, approximately $240 per square foot. 9204 Dawnshire Rd is a home located in Wake County with nearby schools including Durant Road Elementary, Durant Road Middle, and Millbrook High School.
Ownership History
Date
Name
Owned For
Owner Type
Purchase Details
Closed on
Oct 30, 2002
Sold by
Diane E Olech Living Trust
Bought by
Seagraves Kathleen J
Current Estimated Value
Home Financials for this Owner
Home Financials are based on the most recent Mortgage that was taken out on this home.
Original Mortgage
$145,000
Interest Rate
6.01%
Purchase Details
Closed on
Aug 16, 1999
Sold by
Olech Michael E and Olech Diane E
Bought by
Diane E Olech Living Trust
Purchase Details
Closed on
Oct 26, 1998
Sold by
Murphy Tony E and Murphy Kim
Bought by
Olech Michael E and Olech Diane E
Home Financials for this Owner
Home Financials are based on the most recent Mortgage that was taken out on this home.
Original Mortgage
$143,100
Interest Rate
6.76%
Purchase Details
Closed on
Feb 2, 1998
Sold by
The Drees Company
Bought by
Murphy Tony E
Home Financials for this Owner
Home Financials are based on the most recent Mortgage that was taken out on this home.
Original Mortgage
$168,700
Interest Rate
6.86%
Create a Home Valuation Report for This Property
The Home Valuation Report is an in-depth analysis detailing your home's value as well as a comparison with similar homes in the area
Home Values in the Area
Average Home Value in this Area
Purchase History
| Date | Buyer | Sale Price | Title Company |
|---|---|---|---|
| Seagraves Kathleen J | $215,000 | -- | |
| Diane E Olech Living Trust | -- | -- | |
| Olech Michael E | $179,000 | -- | |
| Murphy Tony E | $178,000 | -- |
Source: Public Records
Mortgage History
| Date | Status | Borrower | Loan Amount |
|---|---|---|---|
| Closed | Seagraves Kathleen J | $145,000 | |
| Previous Owner | Olech Michael E | $143,100 | |
| Previous Owner | Murphy Tony E | $168,700 | |
| Closed | Olech Michael E | $17,850 |
Source: Public Records
Tax History Compared to Growth
Tax History
| Year | Tax Paid | Tax Assessment Tax Assessment Total Assessment is a certain percentage of the fair market value that is determined by local assessors to be the total taxable value of land and additions on the property. | Land | Improvement |
|---|---|---|---|---|
| 2025 | $3,663 | $417,738 | $100,000 | $317,738 |
| 2024 | $3,648 | $417,738 | $100,000 | $317,738 |
| 2023 | $3,482 | $317,598 | $80,000 | $237,598 |
| 2022 | $3,236 | $317,598 | $80,000 | $237,598 |
| 2021 | $3,110 | $317,598 | $80,000 | $237,598 |
| 2020 | $3,054 | $317,598 | $80,000 | $237,598 |
| 2019 | $2,939 | $251,855 | $73,000 | $178,855 |
| 2018 | $2,772 | $251,855 | $73,000 | $178,855 |
| 2017 | $2,640 | $251,855 | $73,000 | $178,855 |
| 2016 | $2,586 | $251,855 | $73,000 | $178,855 |
| 2015 | $2,596 | $248,763 | $68,000 | $180,763 |
| 2014 | $2,462 | $248,763 | $68,000 | $180,763 |
Source: Public Records
Map
Nearby Homes
- 9505 Crestland Woods Dr
- 9512 Anson Grove Ln
- 9100 Deershire Ct
- 2324 Dahlgreen Rd
- 9101 Jackknife Trail
- 2408 Deanwood Dr
- 11001 Louson Place
- 8700 Den Ct
- 9012 Walking Stick Trail
- 11020 Southwalk Ln
- 3212 Loyal Ln
- 9013 Tenderfoot Trail
- 11035 Southwalk Ln
- 8913 Walking Stick Trail
- 8600 Clivedon Dr
- 8516 Wheeling Dr
- 2505 Coxindale Dr
- 1301 Durlain Dr Unit 103
- 1310 Durlain Dr Unit 103
- 2709 Iman Dr
- 9208 Dawnshire Rd
- 9200 Dawnshire Rd
- 2809 Dahlgreen Rd
- 9212 Dawnshire Rd
- 9116 Dawnshire Rd
- 2813 Dahlgreen Rd
- 2805 Dahlgreen Rd
- 9205 Dawnshire Rd
- 9201 Dawnshire Rd
- 2817 Dahlgreen Rd
- 2801 Dahlgreen Rd
- 9209 Dawnshire Rd
- 9216 Dawnshire Rd
- 9117 Dawnshire Rd
- 9112 Dawnshire Rd
- 9213 Dawnshire Rd
- 2725 Dahlgreen Rd
- 9113 Dawnshire Rd
- 9108 Dawnshire Rd
- 9220 Dawnshire Rd