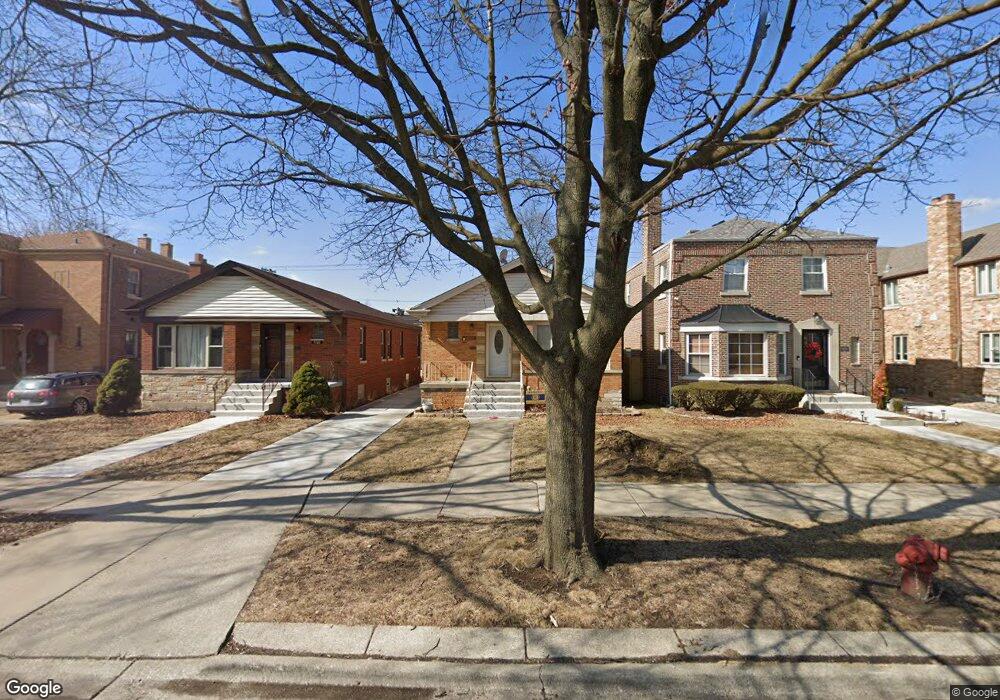
9204 S Claremont Ave Chicago, IL 60643
Beverly NeighborhoodEstimated Value: $308,000 - $401,000
3
Beds
1
Bath
1,150
Sq Ft
$306/Sq Ft
Est. Value
About This Home
This home is located at 9204 S Claremont Ave, Chicago, IL 60643 and is currently estimated at $352,340, approximately $306 per square foot. 9204 S Claremont Ave is a home located in Cook County with nearby schools including Kellogg Elementary School, Morgan Park High School, and Christ The King Elementary School.
Ownership History
Date
Name
Owned For
Owner Type
Purchase Details
Closed on
Feb 9, 2001
Sold by
Mcgee Adrienne and Agyeman Adrienne
Bought by
Agyeman Adrienne and Agyeman Kenneth
Current Estimated Value
Home Financials for this Owner
Home Financials are based on the most recent Mortgage that was taken out on this home.
Original Mortgage
$175,100
Outstanding Balance
$75,275
Interest Rate
9.65%
Estimated Equity
$277,065
Purchase Details
Closed on
May 10, 1997
Sold by
Mcgee Jerry and Mcgee Adrienne
Bought by
Mcgee Adrienne
Purchase Details
Closed on
Apr 5, 1996
Sold by
Sommer Walter W
Bought by
Mcghee Jerry and Mcghee Norienne
Home Financials for this Owner
Home Financials are based on the most recent Mortgage that was taken out on this home.
Original Mortgage
$120,800
Interest Rate
7.44%
Purchase Details
Closed on
Feb 24, 1994
Sold by
Va
Bought by
Bankers Trust Company Of California Na
Create a Home Valuation Report for This Property
The Home Valuation Report is an in-depth analysis detailing your home's value as well as a comparison with similar homes in the area
Home Values in the Area
Average Home Value in this Area
Purchase History
| Date | Buyer | Sale Price | Title Company |
|---|---|---|---|
| Agyeman Adrienne | -- | Law Title | |
| Mcgee Adrienne | -- | -- | |
| Mcghee Jerry | -- | Nations Title Agency | |
| Bankers Trust Company Of California Na | -- | -- |
Source: Public Records
Mortgage History
| Date | Status | Borrower | Loan Amount |
|---|---|---|---|
| Open | Agyeman Adrienne | $175,100 | |
| Closed | Mcghee Jerry | $120,800 |
Source: Public Records
Tax History Compared to Growth
Tax History
| Year | Tax Paid | Tax Assessment Tax Assessment Total Assessment is a certain percentage of the fair market value that is determined by local assessors to be the total taxable value of land and additions on the property. | Land | Improvement |
|---|---|---|---|---|
| 2024 | $4,163 | $30,000 | $6,445 | $23,555 |
| 2023 | $4,039 | $23,001 | $5,198 | $17,803 |
| 2022 | $4,039 | $23,001 | $5,198 | $17,803 |
| 2021 | $3,966 | $22,999 | $5,197 | $17,802 |
| 2020 | $5,012 | $25,546 | $4,158 | $21,388 |
| 2019 | $4,903 | $27,768 | $4,158 | $23,610 |
| 2018 | $4,819 | $27,768 | $4,158 | $23,610 |
| 2017 | $4,839 | $25,803 | $3,742 | $22,061 |
| 2016 | $4,679 | $25,803 | $3,742 | $22,061 |
| 2015 | $4,258 | $25,803 | $3,742 | $22,061 |
| 2014 | $4,275 | $25,551 | $3,534 | $22,017 |
| 2013 | $4,179 | $25,551 | $3,534 | $22,017 |
Source: Public Records
Map
Nearby Homes
- 9139 S Oakley Ave
- 9310 S Claremont Ave
- 9358 S Claremont Ave
- 9336 S Leavitt St
- 9001 S Bell Ave
- 9406 S Leavitt St
- 9209 S Hoyne Ave
- 9305 S Hoyne Ave
- 2649 W 93rd Place
- 2612 W 89th Place
- 2635 W 94th Place
- 2719 W 94th St
- 9616 S Claremont Ave
- 2014 W Hopkins Place
- 8856 S Washtenaw Ave
- 9646 S Leavitt St
- 9527 S Damen Ave
- 2626 W 96th Place
- 9556 S Winchester Ave
- 8804 S Fairfield Ave
- 9206 S Claremont Ave
- 9200 S Claremont Ave
- 9210 S Claremont Ave
- 9162 S Claremont Ave
- 9214 S Claremont Ave
- 9158 S Claremont Ave
- 9156 S Claremont Ave
- 9218 S Claremont Ave
- 9152 S Claremont Ave
- 9222 S Claremont Ave
- 9205 S Claremont Ave
- 9201 S Claremont Ave
- 9209 S Claremont Ave
- 9163 S Claremont Ave
- 9215 S Claremont Ave
- 9148 S Claremont Ave
- 9159 S Claremont Ave
- 9228 S Claremont Ave
- 9219 S Claremont Ave
- 9153 S Claremont Ave