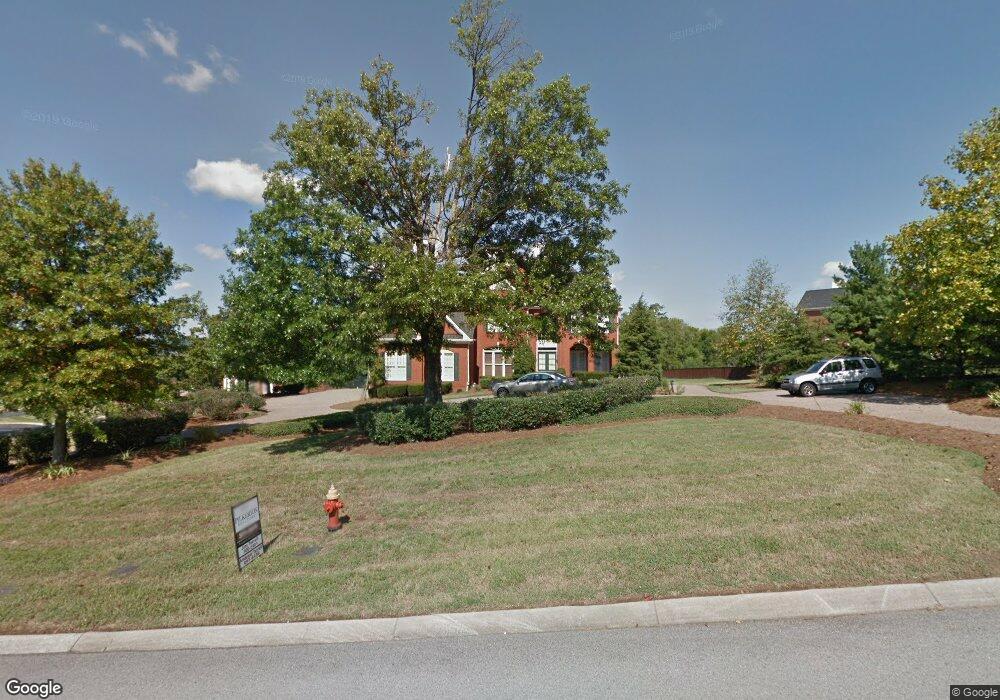
9204 Weston Dr Brentwood, TN 37027
Estimated Value: $1,685,723 - $1,888,000
--
Bed
6
Baths
3,760
Sq Ft
$465/Sq Ft
Est. Value
About This Home
This home is located at 9204 Weston Dr, Brentwood, TN 37027 and is currently estimated at $1,749,681, approximately $465 per square foot. 9204 Weston Dr is a home located in Williamson County with nearby schools including Edmondson Elementary School, Brentwood Middle School, and Brentwood High School.
Ownership History
Date
Name
Owned For
Owner Type
Purchase Details
Closed on
Jun 27, 2012
Sold by
Hayes Howard B
Bought by
Coe Trevor N and Mcfarlin Elizabeth L
Current Estimated Value
Home Financials for this Owner
Home Financials are based on the most recent Mortgage that was taken out on this home.
Original Mortgage
$43,000
Interest Rate
3.76%
Mortgage Type
Unknown
Purchase Details
Closed on
Nov 24, 2004
Sold by
Theodore Chris and Theodore Virginia
Bought by
Hayes Howard B and Millsap Jean H
Purchase Details
Closed on
Jan 25, 2002
Sold by
John Wieland Homes & Neighborhoods Inc
Bought by
Theodore Chris and Theodore Virginia
Home Financials for this Owner
Home Financials are based on the most recent Mortgage that was taken out on this home.
Original Mortgage
$487,400
Interest Rate
6.63%
Create a Home Valuation Report for This Property
The Home Valuation Report is an in-depth analysis detailing your home's value as well as a comparison with similar homes in the area
Home Values in the Area
Average Home Value in this Area
Purchase History
| Date | Buyer | Sale Price | Title Company |
|---|---|---|---|
| Coe Trevor N | $575,000 | None Available | |
| Hayes Howard B | $570,000 | -- | |
| Theodore Chris | $649,900 | Realty Title & Escrow Co Inc |
Source: Public Records
Mortgage History
| Date | Status | Borrower | Loan Amount |
|---|---|---|---|
| Closed | Coe Trevor N | $43,000 | |
| Open | Coe Trevor N | $417,000 | |
| Previous Owner | Theodore Chris | $487,400 |
Source: Public Records
Tax History Compared to Growth
Tax History
| Year | Tax Paid | Tax Assessment Tax Assessment Total Assessment is a certain percentage of the fair market value that is determined by local assessors to be the total taxable value of land and additions on the property. | Land | Improvement |
|---|---|---|---|---|
| 2025 | $4,716 | $399,025 | $143,750 | $255,275 |
| 2024 | $4,716 | $217,325 | $62,500 | $154,825 |
| 2023 | $4,716 | $217,325 | $62,500 | $154,825 |
| 2022 | $4,716 | $217,325 | $62,500 | $154,825 |
| 2021 | $4,716 | $217,325 | $62,500 | $154,825 |
| 2020 | $4,599 | $178,250 | $42,500 | $135,750 |
| 2019 | $4,599 | $178,250 | $42,500 | $135,750 |
| 2018 | $4,474 | $178,250 | $42,500 | $135,750 |
| 2017 | $4,439 | $178,250 | $42,500 | $135,750 |
| 2016 | $0 | $178,250 | $42,500 | $135,750 |
| 2015 | -- | $172,975 | $42,500 | $130,475 |
| 2014 | $761 | $172,975 | $42,500 | $130,475 |
Source: Public Records
Map
Nearby Homes
- 1136 Haverhill Dr
- 9232 Queensboro Ct
- 9209 Cherokee Ln
- 9211 Fox Run Dr
- 1112 Indian Point Dr
- 820 Coxboro Dr
- 1236 Monarch Way
- 810 Steeplechase Dr
- 9305 Atherton Dr
- 1115 Wilson Pike
- 9266 Chevoit Dr
- 691 Green Hill Blvd
- 1302 Twin Springs Dr
- 9316 Lake Shore Dr
- 8210 Halford Place
- 703 Ben Nevis Ct
- 9307 Navaho Dr
- 9479 Chesapeake Dr
- 712 Wilson Pike
- 9729 Concord Rd
- 9206 Weston Dr
- 1081 Warrington Ct
- 1052 Wilshire Way
- 1056 Wilshire Way
- 9190 Weston Dr
- 9205 Weston Dr
- 1085 Warrington Ct
- 9195 Weston Dr
- 9186 Weston Dr
- 9209 Weston Dr
- 1088 Warrington Ct
- 9191 Weston Dr
- 9187 Weston Dr
- 1089 Warrington Ct
- 1066 Wilshire Way
- 9214 Weston Dr
- 1045 Weston Ct
- 9183 Weston Dr
- 1090 Wilshire Way
- 1098 Lansdowne Approach