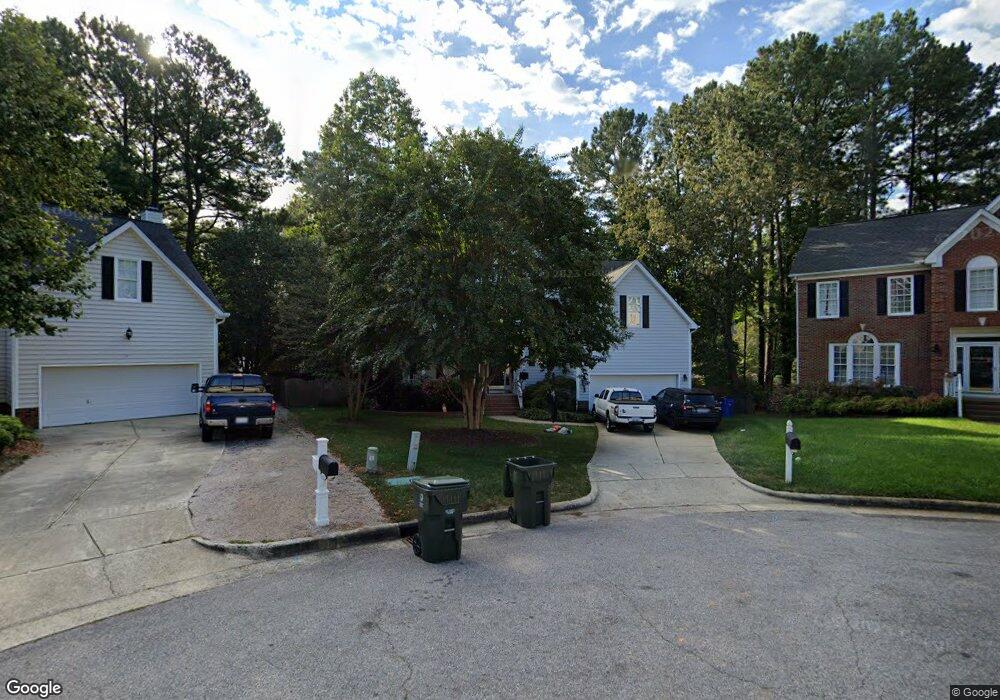
9204 Zermatt Ct Raleigh, NC 27617
Umstead NeighborhoodEstimated Value: $602,360 - $657,000
5
Beds
3
Baths
3,149
Sq Ft
$199/Sq Ft
Est. Value
About This Home
This home is located at 9204 Zermatt Ct, Raleigh, NC 27617 and is currently estimated at $626,090, approximately $198 per square foot. 9204 Zermatt Ct is a home located in Wake County with nearby schools including Sycamore Creek Elementary School, Pine Hollow Middle School, and Leesville Road High School.
Ownership History
Date
Name
Owned For
Owner Type
Purchase Details
Closed on
Aug 13, 2018
Sold by
Bateman Mark H and Bateman Jennifer R
Bought by
Lynch Ryan P and Lynch Stephanie R
Current Estimated Value
Home Financials for this Owner
Home Financials are based on the most recent Mortgage that was taken out on this home.
Original Mortgage
$347,643
Outstanding Balance
$301,914
Interest Rate
4.5%
Mortgage Type
New Conventional
Estimated Equity
$324,176
Purchase Details
Closed on
Feb 2, 2005
Sold by
Gorski Daniel and Gorski Kristi
Bought by
Bateman Mark H and Bateman Jennifer R
Home Financials for this Owner
Home Financials are based on the most recent Mortgage that was taken out on this home.
Original Mortgage
$205,600
Interest Rate
5.61%
Mortgage Type
Fannie Mae Freddie Mac
Purchase Details
Closed on
Feb 20, 1998
Sold by
St Lawrence Homes Inc
Bought by
Gorski Daniel and Gorski Kristi
Create a Home Valuation Report for This Property
The Home Valuation Report is an in-depth analysis detailing your home's value as well as a comparison with similar homes in the area
Home Values in the Area
Average Home Value in this Area
Purchase History
| Date | Buyer | Sale Price | Title Company |
|---|---|---|---|
| Lynch Ryan P | $380,000 | None Available | |
| Bateman Mark H | $257,000 | -- | |
| Gorski Daniel | $200,500 | -- |
Source: Public Records
Mortgage History
| Date | Status | Borrower | Loan Amount |
|---|---|---|---|
| Open | Lynch Ryan P | $347,643 | |
| Previous Owner | Bateman Mark H | $205,600 |
Source: Public Records
Tax History Compared to Growth
Tax History
| Year | Tax Paid | Tax Assessment Tax Assessment Total Assessment is a certain percentage of the fair market value that is determined by local assessors to be the total taxable value of land and additions on the property. | Land | Improvement |
|---|---|---|---|---|
| 2025 | $4,824 | $550,798 | $140,000 | $410,798 |
| 2024 | $4,804 | $550,798 | $140,000 | $410,798 |
| 2023 | $4,023 | $367,239 | $86,000 | $281,239 |
| 2022 | $3,738 | $367,239 | $86,000 | $281,239 |
| 2021 | $3,593 | $367,239 | $86,000 | $281,239 |
| 2020 | $3,528 | $367,239 | $86,000 | $281,239 |
| 2019 | $3,491 | $299,506 | $86,000 | $213,506 |
| 2018 | $0 | $299,506 | $86,000 | $213,506 |
| 2017 | $3,136 | $299,506 | $86,000 | $213,506 |
| 2016 | $3,071 | $299,506 | $86,000 | $213,506 |
| 2015 | $3,102 | $297,642 | $82,000 | $215,642 |
| 2014 | $2,942 | $297,642 | $82,000 | $215,642 |
Source: Public Records
Map
Nearby Homes
- 6516 Englehardt Dr
- 9413 Bells Valley Dr
- 9116 Erinsbrook Dr
- 9600 Center Cross Ct
- 7100 Fugate Ct
- 7104 Fugate Ct
- 6920 Lamarsh Ct
- 9808 Goodrum Ct
- 7846 Cape Charles Dr
- 7862 Cape Charles Dr
- 8721 Little Deer Ln
- 6123 Blakeman Ln
- 10901 Bayflower Way
- 10907 Bayflower Way
- 10917 Bayflower Way
- 10900 Bayflower Way
- 5950 Dunzo Dr
- 10906 Bayflower Way
- 5900 Dunzo Dr
- 5952 Dunzo Dr
- 9208 Zermatt Ct
- 9200 Zermatt Ct
- 9204 Miranda Dr
- 9212 Miranda Dr
- 9200 Miranda Dr
- 9216 Miranda Dr
- 9212 Zermatt Ct
- 9116 Miranda Dr
- 6509 Vosburgh Dr
- 9201 Zermatt Ct
- 9224 Miranda Dr
- 9112 Miranda Dr
- 9205 Zermatt Ct
- 9213 Zermatt Ct
- 9228 Miranda Dr
- 6505 Vosburgh Dr
- 9232 Miranda Dr
- 9109 Rhinebeck Ct
- 6501 Vosburgh Dr
- 6512 Vosburgh Dr