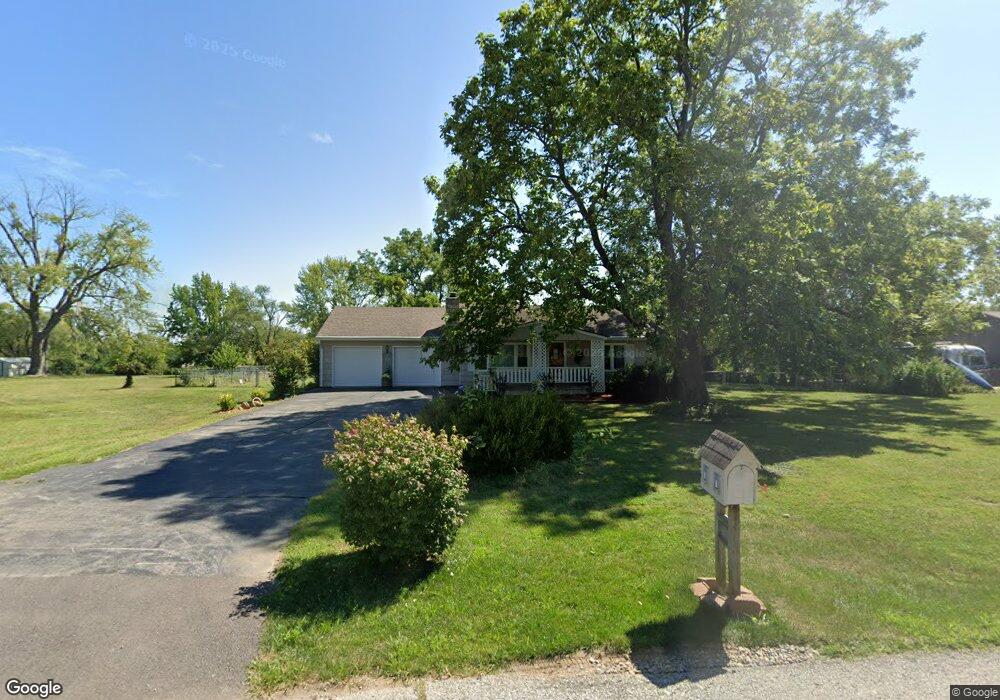
9207 Stubbs Rd Kansas City, MO 64138
Highview Estates NeighborhoodEstimated Value: $183,000 - $241,000
3
Beds
1
Bath
1,120
Sq Ft
$192/Sq Ft
Est. Value
About This Home
This home is located at 9207 Stubbs Rd, Kansas City, MO 64138 and is currently estimated at $214,588, approximately $191 per square foot. 9207 Stubbs Rd is a home located in Jackson County with nearby schools including Truman Elementary School, St Regis School, and Islamic School of Greater Kansas City.
Ownership History
Date
Name
Owned For
Owner Type
Purchase Details
Closed on
Jul 22, 2009
Sold by
Reynolds Norma Jean Loucks
Bought by
Young Richard and Young Diane B
Current Estimated Value
Home Financials for this Owner
Home Financials are based on the most recent Mortgage that was taken out on this home.
Original Mortgage
$107,000
Outstanding Balance
$70,958
Interest Rate
5.71%
Mortgage Type
VA
Estimated Equity
$143,630
Purchase Details
Closed on
Apr 19, 1996
Sold by
Wolfe Paul D and Wolfe Leisa G
Bought by
Zipp Peter B and Zipp Johanna C
Home Financials for this Owner
Home Financials are based on the most recent Mortgage that was taken out on this home.
Original Mortgage
$51,789
Interest Rate
7.93%
Mortgage Type
FHA
Purchase Details
Closed on
Aug 16, 1995
Sold by
Mackay Lachlan E and Mackay Sinclair James
Bought by
Wolfe Paul D
Home Financials for this Owner
Home Financials are based on the most recent Mortgage that was taken out on this home.
Original Mortgage
$100,000
Interest Rate
11.5%
Create a Home Valuation Report for This Property
The Home Valuation Report is an in-depth analysis detailing your home's value as well as a comparison with similar homes in the area
Home Values in the Area
Average Home Value in this Area
Purchase History
| Date | Buyer | Sale Price | Title Company |
|---|---|---|---|
| Young Richard | -- | First American Title | |
| Zipp Peter B | -- | Stewart Title | |
| Wolfe Paul D | -- | -- |
Source: Public Records
Mortgage History
| Date | Status | Borrower | Loan Amount |
|---|---|---|---|
| Open | Young Richard | $107,000 | |
| Previous Owner | Zipp Peter B | $51,789 | |
| Previous Owner | Wolfe Paul D | $100,000 |
Source: Public Records
Tax History Compared to Growth
Tax History
| Year | Tax Paid | Tax Assessment Tax Assessment Total Assessment is a certain percentage of the fair market value that is determined by local assessors to be the total taxable value of land and additions on the property. | Land | Improvement |
|---|---|---|---|---|
| 2025 | $2,632 | $27,891 | $8,349 | $19,542 |
| 2024 | $2,632 | $30,400 | $7,691 | $22,709 |
| 2023 | $2,584 | $30,400 | $7,691 | $22,709 |
| 2022 | $2,088 | $21,090 | $5,754 | $15,336 |
| 2021 | $1,801 | $21,090 | $5,754 | $15,336 |
| 2020 | $1,667 | $18,444 | $5,754 | $12,690 |
| 2019 | $1,576 | $18,444 | $5,754 | $12,690 |
| 2018 | $1,469 | $16,053 | $5,008 | $11,045 |
| 2017 | $1,469 | $16,053 | $5,008 | $11,045 |
| 2016 | $1,475 | $15,650 | $3,000 | $12,650 |
| 2014 | $1,459 | $15,650 | $3,000 | $12,650 |
Source: Public Records
Map
Nearby Homes
- 9420 Ralston Ave
- 10500 E Bannister Rd
- 10321 E 95th Terrace
- 10907 E 98th Terrace
- 8505 Pershing Rd
- 9425 E 90th Terrace
- 8827 Larson Ave
- 8531 Vassar Ave
- 8512 Maywood Ave
- 8400 Willow Way
- 8324 Pershing Rd
- 11909 E 85th St
- 11911 E 85th St
- 8711 Crysler Ave
- 8320 Willow Way
- 8324 Hedges Ave
- 8618 Arlington Ave
- 9901 E 85th St
- 9721 Elm Ave
- 8421 Hawthorne Place
- 9211 Stubbs Rd
- 9215 Stubbs Rd
- 9200 Northern St
- 9219 Stubbs Rd
- 9121 Stubbs Rd
- 10908 E 92nd St
- 9216 Stubbs Rd
- 9218 Northern St
- 9218 Northern St
- 9221 Stubbs Rd
- 11012 E 92nd St
- 9220 Stubbs Rd
- 9209 Northern St
- 9203 Northern St
- 9301 Stubbs Rd
- 9304 Stubbs Rd
- 9100 Stubbs Rd
- 9323 Stubbs Rd
- 9203 Olmstead Rd
- 11030 E 92nd St