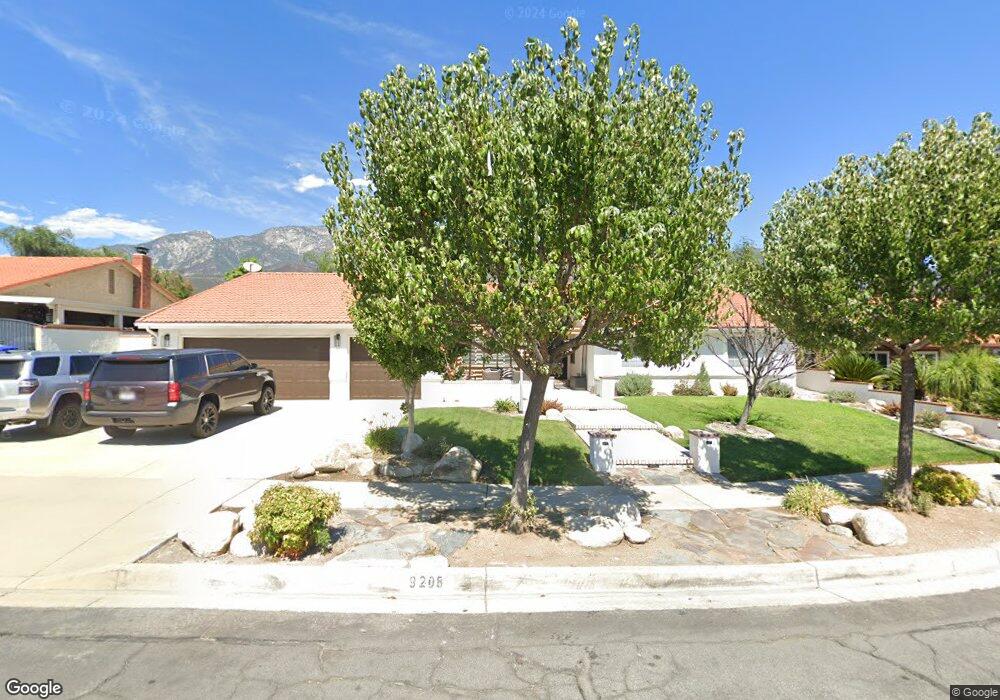
9208 Regency Way Rancho Cucamonga, CA 91701
Estimated Value: $1,059,000 - $1,139,000
5
Beds
3
Baths
2,594
Sq Ft
$419/Sq Ft
Est. Value
About This Home
This home is located at 9208 Regency Way, Rancho Cucamonga, CA 91701 and is currently estimated at $1,085,626, approximately $418 per square foot. 9208 Regency Way is a home located in San Bernardino County with nearby schools including Carnelian Elementary, Alta Loma Junior High, and Alta Loma High.
Ownership History
Date
Name
Owned For
Owner Type
Purchase Details
Closed on
Oct 9, 2003
Sold by
Romero Kevin
Bought by
Kochman Paul and Kochman Kelly
Current Estimated Value
Home Financials for this Owner
Home Financials are based on the most recent Mortgage that was taken out on this home.
Original Mortgage
$399,920
Interest Rate
5.89%
Mortgage Type
Purchase Money Mortgage
Purchase Details
Closed on
Mar 20, 2001
Sold by
Gusman Frances S and Frances S Gusman Revocable Tru
Bought by
Romero Kevin
Home Financials for this Owner
Home Financials are based on the most recent Mortgage that was taken out on this home.
Original Mortgage
$130,000
Interest Rate
6.92%
Purchase Details
Closed on
Aug 26, 1999
Sold by
Gusman Frances S
Bought by
Gusman Frances S and Frances S Gusman Revocable Tru
Create a Home Valuation Report for This Property
The Home Valuation Report is an in-depth analysis detailing your home's value as well as a comparison with similar homes in the area
Home Values in the Area
Average Home Value in this Area
Purchase History
| Date | Buyer | Sale Price | Title Company |
|---|---|---|---|
| Kochman Paul | $500,000 | Fidelity National Title | |
| Romero Kevin | $280,000 | Orange Coast Title | |
| Gusman Frances S | -- | -- |
Source: Public Records
Mortgage History
| Date | Status | Borrower | Loan Amount |
|---|---|---|---|
| Previous Owner | Kochman Paul | $399,920 | |
| Previous Owner | Romero Kevin | $130,000 |
Source: Public Records
Tax History Compared to Growth
Tax History
| Year | Tax Paid | Tax Assessment Tax Assessment Total Assessment is a certain percentage of the fair market value that is determined by local assessors to be the total taxable value of land and additions on the property. | Land | Improvement |
|---|---|---|---|---|
| 2025 | $7,676 | $710,756 | $248,813 | $461,943 |
| 2024 | $7,676 | $696,819 | $243,934 | $452,885 |
| 2023 | $7,502 | $683,156 | $239,151 | $444,005 |
| 2022 | $7,484 | $669,761 | $234,462 | $435,299 |
| 2021 | $7,482 | $656,629 | $229,865 | $426,764 |
| 2020 | $12,519 | $649,896 | $227,508 | $422,388 |
| 2019 | $12,592 | $637,153 | $223,047 | $414,106 |
| 2018 | $12,429 | $624,660 | $218,674 | $405,986 |
| 2017 | $6,768 | $612,411 | $214,386 | $398,025 |
| 2016 | $6,583 | $600,403 | $210,182 | $390,221 |
| 2015 | $6,542 | $591,385 | $207,025 | $384,360 |
| 2014 | $6,357 | $579,801 | $202,970 | $376,831 |
Source: Public Records
Map
Nearby Homes
- 6036 Eastwood Ave
- 9179 Lemon Ave
- 9438 La Gloria Dr
- 6108 Vineyard Ave
- 6055 Amethyst Ave
- 9513 Sunflower St
- 9504 Lemon Ave
- 8911 Mustang Rd
- 9160 Garden St
- 6155 Klusman Ave
- 9140 Garden St
- 6669 Eastwood Ave
- 8990 19th St Unit 236
- 8990 19th St Unit 232
- 8990 19th St Unit 314
- 8990 19th St Unit 376
- 8990 19th St Unit 241
- 8990 19th St Unit 201
- 8990 19th St Unit 304
- 8990 19th St Unit 426
- 9196 Regency Way
- 9220 Regency Way
- 9211 Banyan St
- 9221 Banyan St
- 9197 Banyan St
- 9184 Regency Way
- 6147 Orangewood Dr
- 9225 Banyan St
- 9197 Regency Way
- 9185 Banyan St
- 9185 Regency Way
- 9236 Mandarin Ave
- 9255 Banyan St
- 6176 Orangewood Dr
- 6093 Eastwood Ave
- 6140 Crystal Dr
- 6124 Crystal Dr
- 6187 Crystal Dr
- 6154 Crystal Dr
- 6110 Crystal Dr