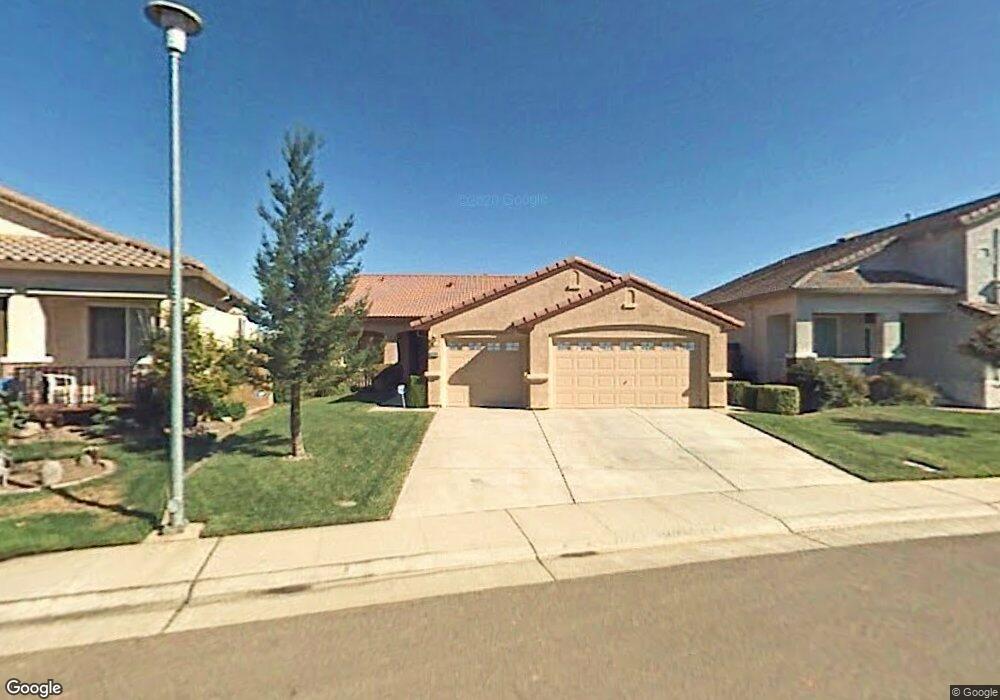
9209 Brevard Dr Sacramento, CA 95829
Estimated Value: $380,000 - $595,000
3
Beds
2
Baths
1,700
Sq Ft
$304/Sq Ft
Est. Value
About This Home
This home is located at 9209 Brevard Dr, Sacramento, CA 95829 and is currently estimated at $517,048, approximately $304 per square foot. 9209 Brevard Dr is a home located in Sacramento County with nearby schools including Maeola E. Beitzel Elementary School, T. R. Smedberg Middle School, and Sheldon High School.
Ownership History
Date
Name
Owned For
Owner Type
Purchase Details
Closed on
Dec 16, 2009
Sold by
Vocker Mike
Bought by
Rundall William A and Lau Sally
Current Estimated Value
Home Financials for this Owner
Home Financials are based on the most recent Mortgage that was taken out on this home.
Original Mortgage
$168,000
Outstanding Balance
$109,467
Interest Rate
4.88%
Mortgage Type
New Conventional
Estimated Equity
$407,581
Purchase Details
Closed on
Feb 20, 2003
Sold by
Green Michael R
Bought by
Vocker Mike
Home Financials for this Owner
Home Financials are based on the most recent Mortgage that was taken out on this home.
Original Mortgage
$209,600
Interest Rate
5.93%
Purchase Details
Closed on
Oct 1, 2001
Sold by
Elliott Homes Inc
Bought by
Green Michael R
Home Financials for this Owner
Home Financials are based on the most recent Mortgage that was taken out on this home.
Original Mortgage
$163,300
Interest Rate
6.9%
Create a Home Valuation Report for This Property
The Home Valuation Report is an in-depth analysis detailing your home's value as well as a comparison with similar homes in the area
Home Values in the Area
Average Home Value in this Area
Purchase History
| Date | Buyer | Sale Price | Title Company |
|---|---|---|---|
| Rundall William A | $210,000 | Cornerstone Title Company | |
| Vocker Mike | $262,000 | Alliance Title Company | |
| Green Michael R | $204,500 | Stewart Title | |
| Elliott Homes Inc | $26,000 | Stewart Title |
Source: Public Records
Mortgage History
| Date | Status | Borrower | Loan Amount |
|---|---|---|---|
| Open | Rundall William A | $168,000 | |
| Previous Owner | Vocker Mike | $209,600 | |
| Previous Owner | Elliott Homes Inc | $163,300 |
Source: Public Records
Tax History Compared to Growth
Tax History
| Year | Tax Paid | Tax Assessment Tax Assessment Total Assessment is a certain percentage of the fair market value that is determined by local assessors to be the total taxable value of land and additions on the property. | Land | Improvement |
|---|---|---|---|---|
| 2025 | $3,000 | $271,057 | $103,260 | $167,797 |
| 2024 | $3,000 | $265,743 | $101,236 | $164,507 |
| 2023 | $2,926 | $260,533 | $99,251 | $161,282 |
| 2022 | $2,877 | $255,425 | $97,305 | $158,120 |
| 2021 | $2,846 | $250,418 | $95,398 | $155,020 |
| 2020 | $2,809 | $247,851 | $94,420 | $153,431 |
| 2019 | $2,759 | $242,992 | $92,569 | $150,423 |
| 2018 | $2,687 | $238,228 | $90,754 | $147,474 |
| 2017 | $2,641 | $233,558 | $88,975 | $144,583 |
| 2016 | $2,513 | $228,980 | $87,231 | $141,749 |
| 2015 | $2,467 | $225,541 | $85,921 | $139,620 |
| 2014 | $2,427 | $221,124 | $84,238 | $136,886 |
Source: Public Records
Map
Nearby Homes
- 7984 Munhall Ct
- 9244 Brevard Ct
- 9273 Amarone Way
- 7929 Symington Way
- 8027 Wente Way
- 7920 Kelvedon Way
- 7904 Symington Way
- 8054 Boeger Ct
- 9172 Durness Way
- 9287 Benefield Ct
- 9040 Durness Way
- 8048 Caymus Dr
- 9042 Epernay Ct
- 9401 Rogers Rd
- 8977 Carlisle Ave
- 9343 Boscastle Way
- 9363 Boscastle Way
- 8216 Rivallo Way
- 9169 Garlington Ct
- 8174 Finmere Way
- 9213 Brevard Dr
- 9205 Brevard Dr
- 7982 Lavenham Ct
- 9217 Brevard Dr
- 9201 Brevard Dr
- 7983 Montevina Dr
- 9212 Brevard Dr
- 7978 Lavenham Ct
- 7979 Montevina Dr
- 8001 Montevina Dr
- 9221 Brevard Dr
- 9216 Brevard Dr
- 7981 Lavenham Ct
- 7973 Montevina Dr
- 9220 Brevard Dr
- 9225 Brevard Dr
- 9183 Brevard Dr
- 7975 Lavenham Ct
- 9229 Amarone Way
- 7969 Montevina Dr