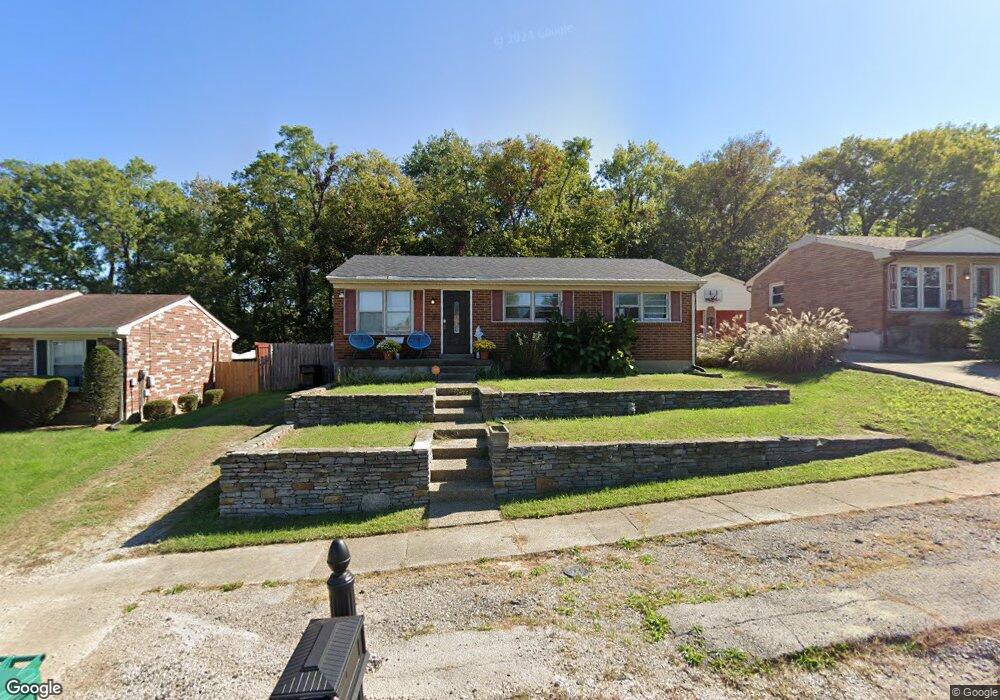
9209 Lantana Dr Louisville, KY 40229
Estimated Value: $231,000 - $260,000
4
Beds
2
Baths
1,950
Sq Ft
$124/Sq Ft
Est. Value
About This Home
This home is located at 9209 Lantana Dr, Louisville, KY 40229 and is currently estimated at $241,552, approximately $123 per square foot. 9209 Lantana Dr is a home located in Jefferson County with nearby schools including Wilt Elementary School, Bates Elementary School, and Price Elementary School.
Ownership History
Date
Name
Owned For
Owner Type
Purchase Details
Closed on
May 27, 2025
Sold by
Blanchard Kendra L and Newton Kendra L
Bought by
Puckett Michael and Puckett Amy S
Current Estimated Value
Home Financials for this Owner
Home Financials are based on the most recent Mortgage that was taken out on this home.
Original Mortgage
$235,653
Outstanding Balance
$235,050
Interest Rate
6.83%
Mortgage Type
FHA
Estimated Equity
$6,502
Purchase Details
Closed on
Apr 12, 2019
Sold by
Hudson Brian and Hudson Kimberly
Bought by
Newton Jeremy N and Blanchard Kendra L
Home Financials for this Owner
Home Financials are based on the most recent Mortgage that was taken out on this home.
Original Mortgage
$86,400
Interest Rate
4.3%
Mortgage Type
New Conventional
Purchase Details
Closed on
Jun 9, 2008
Sold by
Durrett Robert O and Durrett Lindfa M
Bought by
Hudson Brian and Hudson Kimberly
Create a Home Valuation Report for This Property
The Home Valuation Report is an in-depth analysis detailing your home's value as well as a comparison with similar homes in the area
Home Values in the Area
Average Home Value in this Area
Purchase History
| Date | Buyer | Sale Price | Title Company |
|---|---|---|---|
| Puckett Michael | $260,000 | None Listed On Document | |
| Puckett Michael | $260,000 | None Listed On Document | |
| Newton Jeremy N | $108,000 | None Available | |
| Hudson Brian | $120,000 | None Available |
Source: Public Records
Mortgage History
| Date | Status | Borrower | Loan Amount |
|---|---|---|---|
| Open | Puckett Michael | $235,653 | |
| Closed | Puckett Michael | $235,653 | |
| Previous Owner | Newton Jeremy N | $86,400 |
Source: Public Records
Tax History Compared to Growth
Tax History
| Year | Tax Paid | Tax Assessment Tax Assessment Total Assessment is a certain percentage of the fair market value that is determined by local assessors to be the total taxable value of land and additions on the property. | Land | Improvement |
|---|---|---|---|---|
| 2024 | $1,725 | $150,620 | $29,760 | $120,860 |
| 2023 | $1,774 | $150,620 | $29,760 | $120,860 |
| 2022 | $1,780 | $127,100 | $20,000 | $107,100 |
| 2021 | $1,620 | $127,100 | $20,000 | $107,100 |
| 2020 | $1,509 | $127,100 | $20,000 | $107,100 |
| 2019 | $1,378 | $127,100 | $20,000 | $107,100 |
| 2018 | $1,361 | $127,100 | $20,000 | $107,100 |
| 2017 | $1,334 | $127,100 | $20,000 | $107,100 |
| 2013 | $1,200 | $120,000 | $20,000 | $100,000 |
Source: Public Records
Map
Nearby Homes
- 9011 Lantana Dr
- 9000 John Paul Ct
- 6505 Cooper Chapel Rd
- 9304 New Maple Rd
- 8814 Old Ironsides Dr
- 6117 Toebbe Ln
- 9601 McNeely Lake Dr Unit 9601
- 6113 Chambers Way
- 6501 Park Gate Ct
- 6514 Park Club Cir Unit 6514
- 7505 Astrid Way
- 6217 Hackberry Way
- 9109 Maiden Ct
- 6107 Schreiner Ct
- 8523 Gregory Way
- 7100 Alma June Way
- 9807 Spring Pointe Ct
- 6509 Daverman Ct
- 8320 Smyrna Pkwy
- 6806 Creedmoor Ct
- 9207 Lantana Dr
- 9211 Lantana Dr
- 9213 Lantana Dr
- 9205 Lantana Dr
- 9215 Lantana Dr
- 9203 Lantana Dr
- 9208 Lantana Dr
- 9206 Lantana Dr
- 9210 Lantana Dr
- 9204 Lantana Dr
- 9212 Lantana Dr
- 6602 Burlwood Dr
- 9217 Lantana Dr
- 9201 Lantana Dr
- 9214 Lantana Dr
- 6606 Burlwood Dr
- 9200 Lantana Dr
- 9219 Lantana Dr
- 9205 Pagoda Dr
- 9203 Pagoda Dr