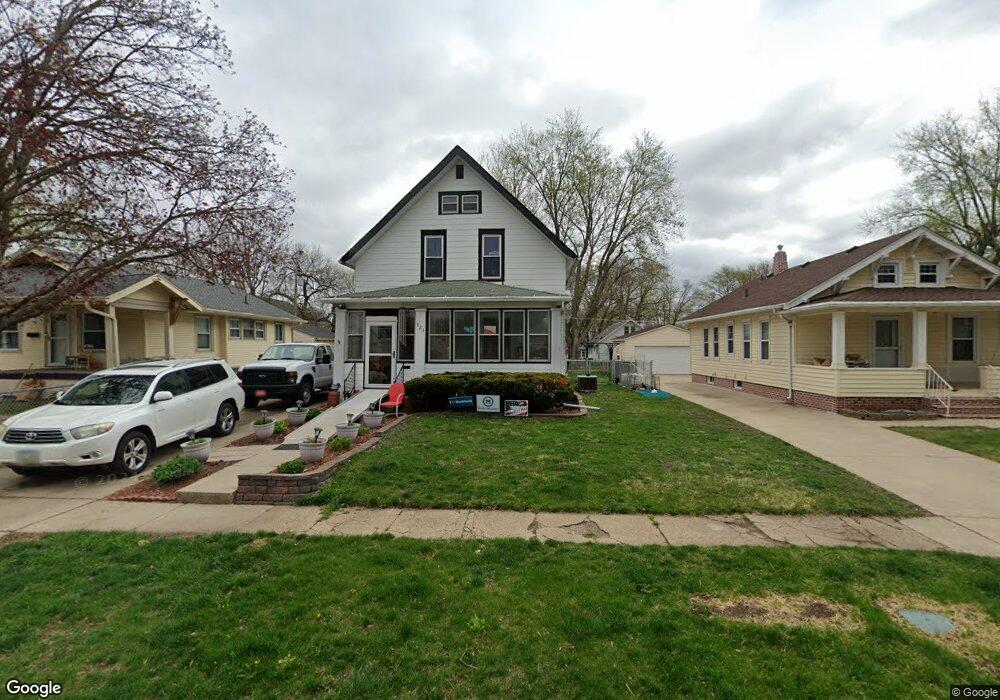
921 40th Place Des Moines, IA 50312
Drake NeighborhoodEstimated Value: $232,000 - $251,000
2
Beds
1
Bath
1,296
Sq Ft
$187/Sq Ft
Est. Value
About This Home
This home is located at 921 40th Place, Des Moines, IA 50312 and is currently estimated at $242,661, approximately $187 per square foot. 921 40th Place is a home located in Polk County with nearby schools including Hubbell Elementary, Roosevelt High School, and St Augustin Catholic School.
Ownership History
Date
Name
Owned For
Owner Type
Purchase Details
Closed on
Jul 13, 2001
Sold by
Rogers Jack W and Rogers Sandra J
Bought by
Neal Jeffrey D and Neal Shawna A
Current Estimated Value
Home Financials for this Owner
Home Financials are based on the most recent Mortgage that was taken out on this home.
Original Mortgage
$132,000
Outstanding Balance
$50,575
Interest Rate
7.22%
Estimated Equity
$192,086
Create a Home Valuation Report for This Property
The Home Valuation Report is an in-depth analysis detailing your home's value as well as a comparison with similar homes in the area
Home Values in the Area
Average Home Value in this Area
Purchase History
| Date | Buyer | Sale Price | Title Company |
|---|---|---|---|
| Neal Jeffrey D | $164,500 | -- |
Source: Public Records
Mortgage History
| Date | Status | Borrower | Loan Amount |
|---|---|---|---|
| Open | Neal Jeffrey D | $132,000 | |
| Closed | Neal Jeffrey D | $24,750 |
Source: Public Records
Tax History Compared to Growth
Tax History
| Year | Tax Paid | Tax Assessment Tax Assessment Total Assessment is a certain percentage of the fair market value that is determined by local assessors to be the total taxable value of land and additions on the property. | Land | Improvement |
|---|---|---|---|---|
| 2025 | $4,232 | $255,600 | $45,800 | $209,800 |
| 2024 | $4,232 | $232,600 | $41,400 | $191,200 |
| 2023 | $4,444 | $232,600 | $41,400 | $191,200 |
| 2022 | $4,408 | $197,400 | $36,400 | $161,000 |
| 2021 | $4,200 | $197,400 | $36,400 | $161,000 |
| 2020 | $4,358 | $176,900 | $32,800 | $144,100 |
| 2019 | $3,952 | $176,900 | $32,800 | $144,100 |
| 2018 | $3,908 | $155,600 | $28,500 | $127,100 |
| 2017 | $3,624 | $155,600 | $28,500 | $127,100 |
| 2016 | $3,526 | $142,500 | $26,000 | $116,500 |
| 2015 | $3,526 | $142,500 | $26,000 | $116,500 |
| 2014 | $3,384 | $141,100 | $25,500 | $115,600 |
Source: Public Records
Map
Nearby Homes
- 1008 Kingman Cir
- 870 39th St
- 1001 42nd St
- 4036 Plainview Dr
- 4200 Kingman Blvd
- 1005 38th St
- 4303 Crocker St
- 725 40th St
- 1070 37th St
- 4000 University Ave Unit 7
- 744 37th St
- 1021 45th St
- 4012 Pleasant St
- 3908 Pleasant St
- 689 42nd St
- 3525 Center St
- 1206 39th St
- 3821 University Ave
- 3406 School St
- 1055 46th St