Estimated Value: $762,492 - $843,000
--
Bed
1
Bath
3,291
Sq Ft
$247/Sq Ft
Est. Value
About This Home
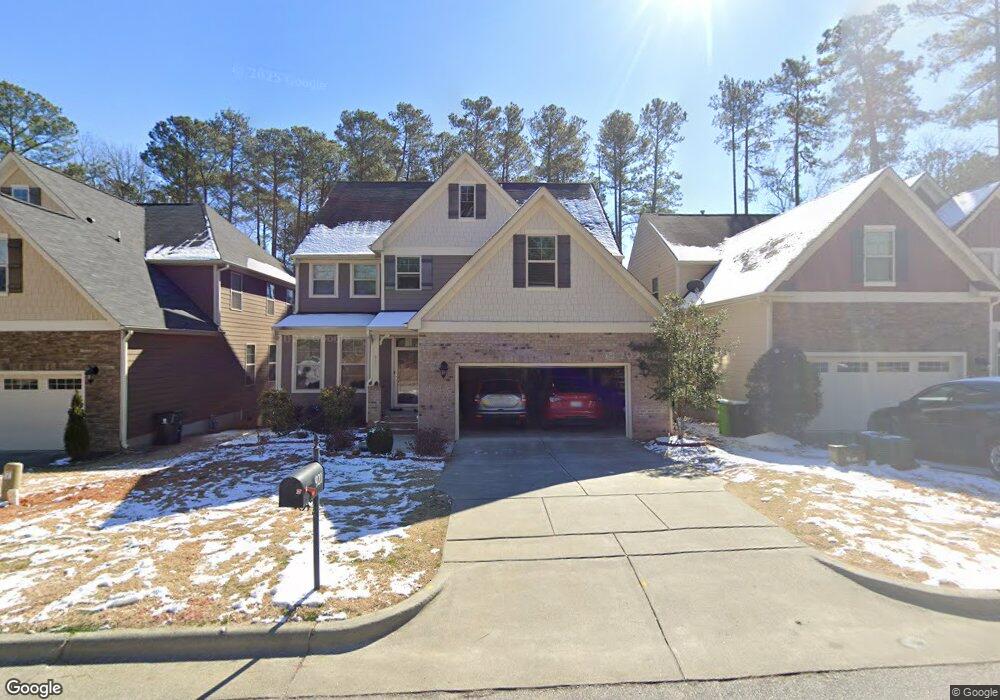
This home is located at 921 Bay Bouquet Ln, Apex, NC 27523 and is currently estimated at $811,373, approximately $246 per square foot. 921 Bay Bouquet Ln is a home with nearby schools including Laurel Park Elementary, Salem Middle, and Apex High School.
Ownership History
Date
Name
Owned For
Owner Type
Purchase Details
Closed on
Nov 23, 2022
Sold by
Vengala Rajendra P and Vengala Ramalakshmi
Bought by
Vengala Family Trust
Current Estimated Value
Purchase Details
Closed on
Jun 6, 2014
Sold by
Level Carolina Homes Llc
Bought by
Vengala Rajendra P and Nukarapu Ramalakshmi
Home Financials for this Owner
Home Financials are based on the most recent Mortgage that was taken out on this home.
Original Mortgage
$305,054
Interest Rate
4.28%
Mortgage Type
New Conventional
Purchase Details
Closed on
Dec 24, 2013
Sold by
Engquist Level Development Llc
Bought by
Level Carolina Homes Llc
Home Financials for this Owner
Home Financials are based on the most recent Mortgage that was taken out on this home.
Original Mortgage
$249,900
Interest Rate
4.38%
Mortgage Type
Future Advance Clause Open End Mortgage
Create a Home Valuation Report for This Property
The Home Valuation Report is an in-depth analysis detailing your home's value as well as a comparison with similar homes in the area
Home Values in the Area
Average Home Value in this Area
Purchase History
| Date | Buyer | Sale Price | Title Company |
|---|---|---|---|
| Vengala Family Trust | -- | -- | |
| Vengala Rajendra P | $339,000 | None Available | |
| Level Carolina Homes Llc | $142,000 | None Available |
Source: Public Records
Mortgage History
| Date | Status | Borrower | Loan Amount |
|---|---|---|---|
| Previous Owner | Vengala Rajendra P | $305,054 | |
| Previous Owner | Level Carolina Homes Llc | $249,900 |
Source: Public Records
Tax History Compared to Growth
Tax History
| Year | Tax Paid | Tax Assessment Tax Assessment Total Assessment is a certain percentage of the fair market value that is determined by local assessors to be the total taxable value of land and additions on the property. | Land | Improvement |
|---|---|---|---|---|
| 2025 | $6,423 | $733,337 | $150,000 | $583,337 |
| 2024 | $6,279 | $733,337 | $150,000 | $583,337 |
| 2023 | $4,976 | $451,795 | $110,000 | $341,795 |
| 2022 | $4,671 | $451,795 | $110,000 | $341,795 |
| 2021 | $4,493 | $451,795 | $110,000 | $341,795 |
| 2020 | $4,448 | $451,795 | $110,000 | $341,795 |
| 2019 | $4,110 | $360,150 | $75,000 | $285,150 |
| 2018 | $3,871 | $360,150 | $75,000 | $285,150 |
| 2017 | $3,603 | $360,150 | $75,000 | $285,150 |
| 2016 | $3,551 | $360,150 | $75,000 | $285,150 |
| 2015 | -- | $340,477 | $60,000 | $280,477 |
| 2014 | -- | $60,000 | $60,000 | $0 |
Source: Public Records
Map
Nearby Homes
- 900 Bay Bouquet Ln
- 958 Bay Bouquet Ln
- 612 Cable Ct
- Harrington End Unit Plan at Parc at Bradley Farm
- Weston End Unit Plan at Parc at Bradley Farm
- Harrington Interior Unit Plan at Parc at Bradley Farm
- 946 Steel Mill Ln
- 835 New Derby Ln
- 802 New Derby Ln
- 717 Sweet Laurel Ln
- 1531 Salem Church Rd
- 1529 Salem Church Rd
- 1009 Tahoe Glen Place
- 728 Blossom Bay Ln
- 810 Richmont Grove Ln
- 1003 Lathrop Ln
- 1005 Lathrop Ln
- 2120 Royal Berry Ct
- 1061 Larabee Ln
- 116 Lost Tree Ln
- 927 Bay Bouquet Ln
- 917 Bay Bouquet Ln
- 913 Bay Bouquet Ln
- 907 Bay Bouquet Ln
- 930 Bay Bouquet Ln
- 912 Bay Bouquet Ln
- 934 Bay Bouquet Ln
- 908 Bay Bouquet Ln
- 2012 Ramblewood Dr
- 938 Bay Bouquet Ln
- 904 Bay Bouquet Ln
- 942 Bay Bouquet Ln
- 947 Bay Bouquet Ln
- 946 Bay Bouquet Ln
- 951 Bay Bouquet Ln
- 950 Bay Bouquet Ln
- 955 Bay Bouquet Ln
- 954 Bay Bouquet Ln
- 833 Claude Laurel Dr
- 962 Bay Bouquet Ln