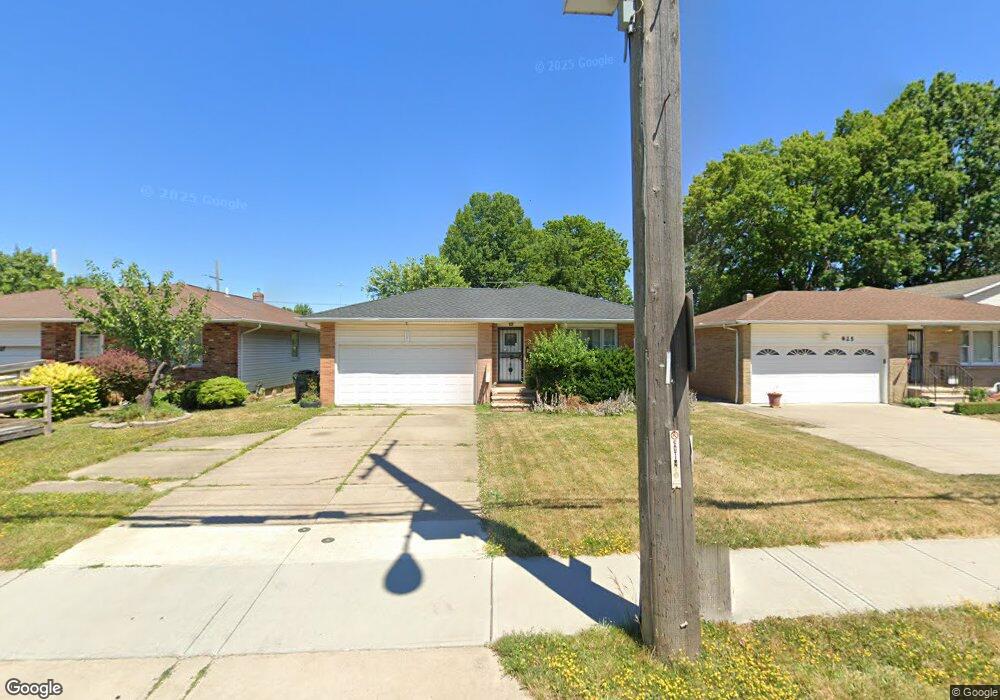
921 E 260th St Euclid, OH 44132
Estimated Value: $153,000 - $185,000
3
Beds
2
Baths
1,330
Sq Ft
$126/Sq Ft
Est. Value
About This Home
This home is located at 921 E 260th St, Euclid, OH 44132 and is currently estimated at $167,343, approximately $125 per square foot. 921 E 260th St is a home located in Cuyahoga County with nearby schools including Shoreview Elementary School, Euclid High School, and Pinnacle Academy.
Ownership History
Date
Name
Owned For
Owner Type
Purchase Details
Closed on
Nov 22, 2023
Sold by
Johnson-Mabrey Rose Marie
Bought by
Johnson Ashley Marie
Current Estimated Value
Purchase Details
Closed on
Oct 20, 1997
Sold by
Bellizzieri Paolo
Bought by
Mabrey Geneva H
Home Financials for this Owner
Home Financials are based on the most recent Mortgage that was taken out on this home.
Original Mortgage
$99,700
Interest Rate
7.65%
Mortgage Type
New Conventional
Purchase Details
Closed on
Oct 21, 1980
Bought by
Bellizzieri Paolo
Purchase Details
Closed on
Apr 19, 1977
Bought by
Newman Builders Inc
Purchase Details
Closed on
Jan 1, 1975
Bought by
West Side Land Co
Create a Home Valuation Report for This Property
The Home Valuation Report is an in-depth analysis detailing your home's value as well as a comparison with similar homes in the area
Home Values in the Area
Average Home Value in this Area
Purchase History
| Date | Buyer | Sale Price | Title Company |
|---|---|---|---|
| Johnson Ashley Marie | -- | None Listed On Document | |
| Mabrey Geneva H | $105,000 | -- | |
| Bellizzieri Paolo | $78,900 | -- | |
| Newman Builders Inc | -- | -- | |
| West Side Land Co | -- | -- |
Source: Public Records
Mortgage History
| Date | Status | Borrower | Loan Amount |
|---|---|---|---|
| Previous Owner | Mabrey Geneva H | $99,700 |
Source: Public Records
Tax History
| Year | Tax Paid | Tax Assessment Tax Assessment Total Assessment is a certain percentage of the fair market value that is determined by local assessors to be the total taxable value of land and additions on the property. | Land | Improvement |
|---|---|---|---|---|
| 2024 | $3,538 | $53,760 | $7,245 | $46,515 |
| 2023 | $1,915 | $30,460 | $6,200 | $24,260 |
| 2022 | $2,490 | $37,835 | $6,195 | $31,640 |
| 2021 | $2,768 | $37,840 | $6,200 | $31,640 |
| 2020 | $2,510 | $32,620 | $5,360 | $27,270 |
| 2019 | $2,256 | $93,200 | $15,300 | $77,900 |
| 2018 | $4,159 | $32,620 | $5,360 | $27,270 |
| 2017 | $3,296 | $29,440 | $4,450 | $24,990 |
| 2016 | $3,303 | $29,440 | $4,450 | $24,990 |
| 2015 | $3,310 | $29,440 | $4,450 | $24,990 |
| 2014 | $3,310 | $29,440 | $4,450 | $24,990 |
Source: Public Records
Map
Nearby Homes
- 825 E 256th St
- 25650 Richards Ave
- 890 E 250th St
- 25700 Briardale Ave
- 24571 Alberton Rd
- 25751 Briardale Ave
- 26430 Drakefield Ave
- 643 E 261st St
- 515 E 250th St
- 815 E 272nd St
- 579 E 260th St
- 27701 Mills Ave Unit 2G
- 25671 Farringdon Ave
- 24181 Devoe Ave
- 571 E 260th St
- 26351 Farringdon Ave
- 25401 Farringdon Ave
- 25731 Zeman Ave
- 464 E 250th St
- 25151 Zeman Ave
- 915 E 260th St
- 925 E 260th St
- 935 E 260th St
- 26058 Benton Ave
- 905 E 260th St
- 26072 Benton Ave
- 906 E 261st St
- 901 E 260th St
- 924 E 260th St
- 930 E 260th St
- 920 E 260th St
- 26086 Benton Ave
- 902 E 261st St
- 934 E 260th St
- 885 E 260th St
- 910 E 260th St
- 26100 Benton Ave
- 886 E 261st St
- 904 E 260th St
- 879 E 260th St
Your Personal Tour Guide
Ask me questions while you tour the home.