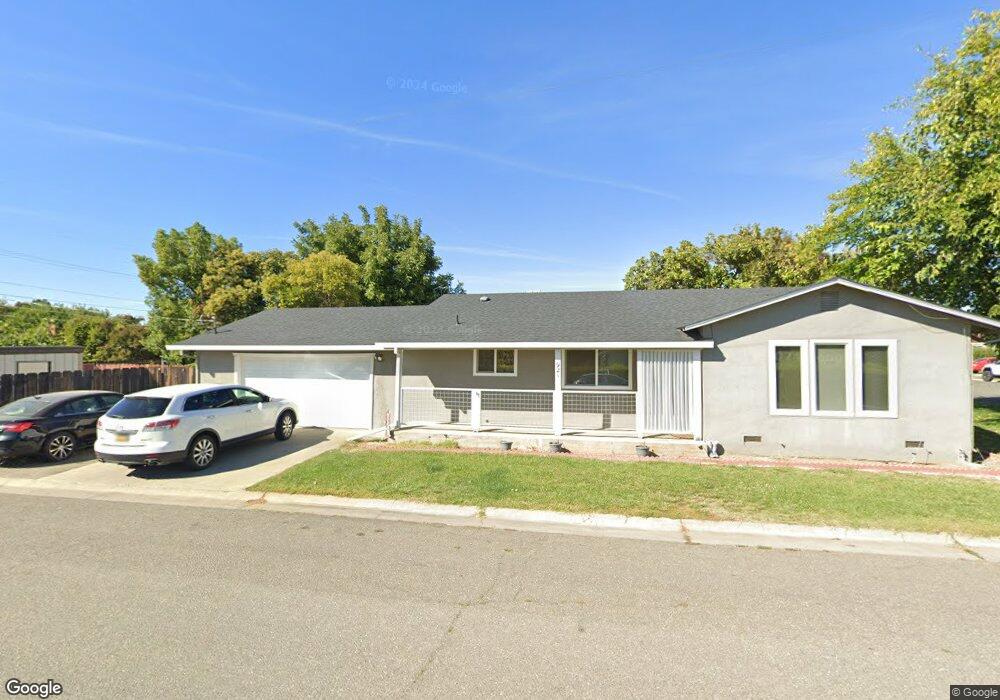
921 Jackson St Willows, CA 95988
Estimated Value: $283,000 - $316,186
2
Beds
2
Baths
1,164
Sq Ft
$253/Sq Ft
Est. Value
About This Home
This home is located at 921 Jackson St, Willows, CA 95988 and is currently estimated at $295,047, approximately $253 per square foot. 921 Jackson St is a home located in Glenn County with nearby schools including Murdock Elementary School, Willows Intermediate School, and Willows High School.
Ownership History
Date
Name
Owned For
Owner Type
Purchase Details
Closed on
Mar 29, 2024
Sold by
Sanchez Nidia A and Dunlap Gregg G
Bought by
Kafader Dakota Lyle James and Kafader Claudia
Current Estimated Value
Home Financials for this Owner
Home Financials are based on the most recent Mortgage that was taken out on this home.
Original Mortgage
$261,900
Outstanding Balance
$258,002
Interest Rate
6.9%
Mortgage Type
New Conventional
Estimated Equity
$37,045
Purchase Details
Closed on
Nov 19, 2019
Sold by
Swaner Leslie C
Bought by
Dunlap Gregg G and Sanchez Nidia A
Home Financials for this Owner
Home Financials are based on the most recent Mortgage that was taken out on this home.
Original Mortgage
$202,891
Interest Rate
3.5%
Mortgage Type
New Conventional
Purchase Details
Closed on
Jan 8, 2013
Sold by
Swaner Leslie
Bought by
Swaner Leslie C
Purchase Details
Closed on
Apr 14, 2004
Sold by
Swaner George
Bought by
Swaner Leslie
Create a Home Valuation Report for This Property
The Home Valuation Report is an in-depth analysis detailing your home's value as well as a comparison with similar homes in the area
Home Values in the Area
Average Home Value in this Area
Purchase History
| Date | Buyer | Sale Price | Title Company |
|---|---|---|---|
| Kafader Dakota Lyle James | $270,000 | Timios Title | |
| Dunlap Gregg G | $210,000 | Timios Title | |
| Swaner Leslie C | -- | None Available | |
| Swaner Leslie | -- | North State Title Co | |
| Swaner Leslie | $163,000 | North State Title Co |
Source: Public Records
Mortgage History
| Date | Status | Borrower | Loan Amount |
|---|---|---|---|
| Open | Kafader Dakota Lyle James | $261,900 | |
| Previous Owner | Dunlap Gregg G | $202,891 |
Source: Public Records
Tax History
| Year | Tax Paid | Tax Assessment Tax Assessment Total Assessment is a certain percentage of the fair market value that is determined by local assessors to be the total taxable value of land and additions on the property. | Land | Improvement |
|---|---|---|---|---|
| 2025 | $3,263 | $275,400 | $45,900 | $229,500 |
| 2024 | $3,263 | $225,158 | $38,596 | $186,562 |
| 2023 | $3,160 | $220,744 | $37,840 | $182,904 |
| 2022 | $3,028 | $216,417 | $37,099 | $179,318 |
| 2021 | $2,913 | $212,174 | $36,372 | $175,802 |
| 2020 | $2,810 | $210,000 | $36,000 | $174,000 |
| 2019 | $2,297 | $159,863 | $33,075 | $126,788 |
| 2018 | $2,269 | $159,863 | $33,075 | $126,788 |
| 2017 | $2,207 | $152,250 | $31,500 | $120,750 |
| 2016 | $2,046 | $145,000 | $30,000 | $115,000 |
| 2015 | $2,025 | $143,000 | $29,000 | $114,000 |
| 2014 | $1,964 | $137,000 | $28,000 | $109,000 |
Source: Public Records
Map
Nearby Homes
- 650 Pacific Ave
- 309 N Merrill Ave
- 1165 Southgate Dr
- 1035 W Walnut St
- 205 N Shasta St
- 151 S Murdock Ave
- 151 N Shasta St
- 251 S Lassen St
- 159 159 S Shasta St
- 159 S Shasta St
- 421 5th St
- 447 S Marshall Ave
- 0 5th St
- 1041 Washington St
- 609 S Lassen St
- 629 S Murdock Ave
- 939 Elm St
- 266 S Yolo St
- 0 E Oak St
- 491 2nd St
Your Personal Tour Guide
Ask me questions while you tour the home.