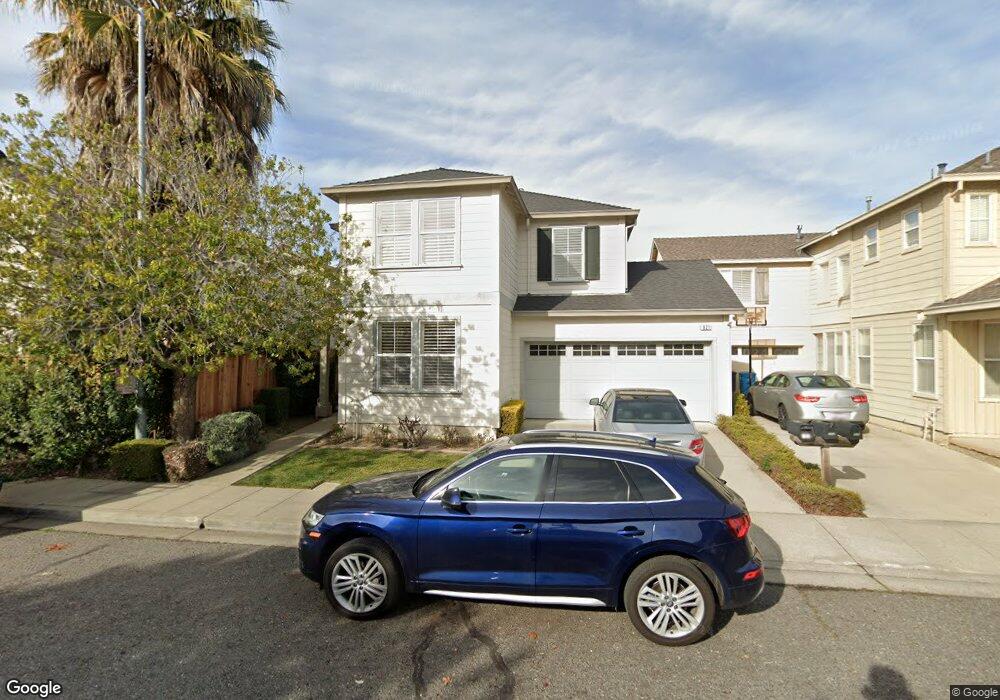
921 Mouton Cir East Palo Alto, CA 94303
Estimated Value: $1,509,909 - $1,879,000
4
Beds
3
Baths
2,260
Sq Ft
$751/Sq Ft
Est. Value
About This Home
This home is located at 921 Mouton Cir, East Palo Alto, CA 94303 and is currently estimated at $1,697,227, approximately $750 per square foot. 921 Mouton Cir is a home located in San Mateo County with nearby schools including Brentwood Academy, Menlo-Atherton High School, and East Palo Alto Academy.
Ownership History
Date
Name
Owned For
Owner Type
Purchase Details
Closed on
Jul 27, 2004
Sold by
David Marsha T
Bought by
Lee Robert A
Current Estimated Value
Home Financials for this Owner
Home Financials are based on the most recent Mortgage that was taken out on this home.
Original Mortgage
$556,000
Outstanding Balance
$281,005
Interest Rate
6.29%
Mortgage Type
Purchase Money Mortgage
Estimated Equity
$1,416,222
Purchase Details
Closed on
Jun 13, 2001
Sold by
Ravenswood Village Llc
Bought by
David Marsha T
Home Financials for this Owner
Home Financials are based on the most recent Mortgage that was taken out on this home.
Original Mortgage
$578,200
Interest Rate
7.25%
Purchase Details
Closed on
Jun 8, 2001
Sold by
David Terrance M
Bought by
David Marsha T
Home Financials for this Owner
Home Financials are based on the most recent Mortgage that was taken out on this home.
Original Mortgage
$578,200
Interest Rate
7.25%
Create a Home Valuation Report for This Property
The Home Valuation Report is an in-depth analysis detailing your home's value as well as a comparison with similar homes in the area
Home Values in the Area
Average Home Value in this Area
Purchase History
| Date | Buyer | Sale Price | Title Company |
|---|---|---|---|
| Lee Robert A | $695,000 | Financial Title Company | |
| David Marsha T | $723,000 | First American Title Co | |
| David Marsha T | -- | First American Title Co |
Source: Public Records
Mortgage History
| Date | Status | Borrower | Loan Amount |
|---|---|---|---|
| Open | Lee Robert A | $556,000 | |
| Previous Owner | David Marsha T | $578,200 | |
| Closed | David Marsha T | $72,200 |
Source: Public Records
Tax History Compared to Growth
Tax History
| Year | Tax Paid | Tax Assessment Tax Assessment Total Assessment is a certain percentage of the fair market value that is determined by local assessors to be the total taxable value of land and additions on the property. | Land | Improvement |
|---|---|---|---|---|
| 2025 | $12,338 | $968,752 | $484,376 | $484,376 |
| 2023 | $12,338 | $931,136 | $465,568 | $465,568 |
| 2022 | $11,479 | $912,880 | $456,440 | $456,440 |
| 2021 | $11,244 | $894,982 | $447,491 | $447,491 |
| 2020 | $11,084 | $885,806 | $442,903 | $442,903 |
| 2019 | $11,117 | $868,438 | $434,219 | $434,219 |
| 2018 | $10,906 | $851,410 | $425,705 | $425,705 |
| 2017 | $10,519 | $834,716 | $417,358 | $417,358 |
| 2016 | $10,421 | $818,350 | $409,175 | $409,175 |
| 2015 | $10,266 | $806,058 | $403,029 | $403,029 |
| 2014 | $8,802 | $676,000 | $338,000 | $338,000 |
Source: Public Records
Map
Nearby Homes
- 956 Mouton Cir
- 1885 E Bayshore Rd Unit 37
- 1885 E Bayshore Rd Unit 71
- 120 Gardenia Way
- 1815 Woodland Ave
- 1811 Woodland Ave
- 1893 Woodland Ave
- 1879 Woodland Ave
- 1597 Edgewood Dr
- 1168 Beech St
- 1788 E Bayshore Rd
- 159 Jasmine Way
- 1982 W Bayshore Rd Unit 121
- 1982 W Bayshore Rd Unit 223
- 1101 Juana Ct
- 2260 Pulgas Ave
- 90 Crescent Dr
- 653 Wildwood Ln
- 2232 Euclid Ave
- 801 Weeks St