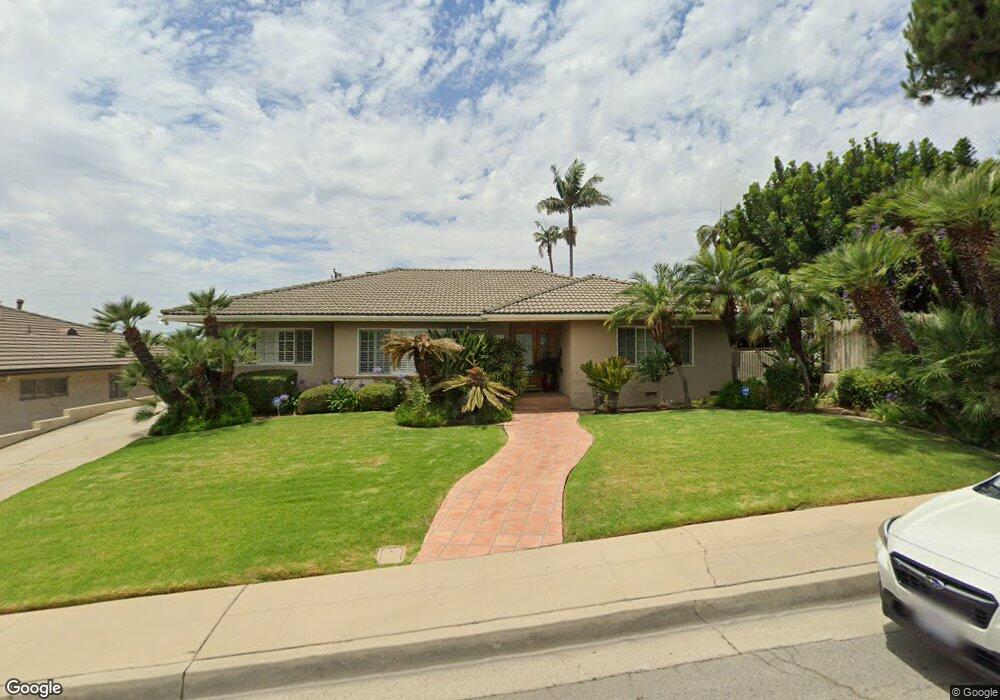
921 N Poplar Ave Montebello, CA 90640
Estimated Value: $1,181,000 - $1,359,000
4
Beds
3
Baths
2,529
Sq Ft
$489/Sq Ft
Est. Value
About This Home
This home is located at 921 N Poplar Ave, Montebello, CA 90640 and is currently estimated at $1,237,067, approximately $489 per square foot. 921 N Poplar Ave is a home located in Los Angeles County with nearby schools including La Merced Elementary School, La Merced Intermediate School, and Montebello High School.
Ownership History
Date
Name
Owned For
Owner Type
Purchase Details
Closed on
May 13, 2023
Sold by
Magdesian Sona
Bought by
Magdesian Andranik
Current Estimated Value
Purchase Details
Closed on
Feb 9, 2016
Sold by
Magdesian Sona
Bought by
Magdesian Sona
Home Financials for this Owner
Home Financials are based on the most recent Mortgage that was taken out on this home.
Original Mortgage
$117,000
Interest Rate
3.97%
Mortgage Type
New Conventional
Purchase Details
Closed on
Jul 13, 2006
Sold by
Magdesian Wahram and Magdesian Sonia
Bought by
Magdesian Wahram
Purchase Details
Closed on
Nov 13, 2002
Sold by
Magdesian Wahram and The Magdesian Living Trust
Bought by
Magdesian Wahram
Home Financials for this Owner
Home Financials are based on the most recent Mortgage that was taken out on this home.
Original Mortgage
$164,000
Interest Rate
5.96%
Purchase Details
Closed on
Nov 16, 1994
Sold by
Magdesian Wahram and Magdesian Sona
Bought by
Magdesian Wahram and The Magdesian Living Trust
Create a Home Valuation Report for This Property
The Home Valuation Report is an in-depth analysis detailing your home's value as well as a comparison with similar homes in the area
Home Values in the Area
Average Home Value in this Area
Purchase History
| Date | Buyer | Sale Price | Title Company |
|---|---|---|---|
| Magdesian Andranik | -- | None Listed On Document | |
| Magdesian Sona | -- | Western Resources Title | |
| Magdesian Wahram | -- | None Available | |
| Magdesian Wahram | -- | Gateway Title Company | |
| Magdesian Wahram | -- | -- |
Source: Public Records
Mortgage History
| Date | Status | Borrower | Loan Amount |
|---|---|---|---|
| Previous Owner | Magdesian Sona | $117,000 | |
| Previous Owner | Magdesian Wahram | $164,000 |
Source: Public Records
Tax History Compared to Growth
Tax History
| Year | Tax Paid | Tax Assessment Tax Assessment Total Assessment is a certain percentage of the fair market value that is determined by local assessors to be the total taxable value of land and additions on the property. | Land | Improvement |
|---|---|---|---|---|
| 2025 | $14,168 | $153,165 | $41,887 | $111,278 |
| 2024 | $14,168 | $981,240 | $765,408 | $215,832 |
| 2023 | $3,041 | $147,219 | $40,261 | $106,958 |
| 2022 | $2,947 | $144,333 | $39,472 | $104,861 |
| 2021 | $2,833 | $141,504 | $38,699 | $102,805 |
| 2019 | $2,702 | $137,308 | $37,552 | $99,756 |
| 2018 | $2,561 | $134,616 | $36,816 | $97,800 |
| 2016 | $2,436 | $129,391 | $35,388 | $94,003 |
| 2015 | $2,327 | $127,448 | $34,857 | $92,591 |
| 2014 | $2,309 | $124,953 | $34,175 | $90,778 |
Source: Public Records
Map
Nearby Homes
- 211 Peacock Ln
- 1004 N Las Flores Ave
- 478 Sycamore Dr W
- 48 Primrose Ct
- 1155 Poppy Ct
- 728 N 3rd St
- 737 N 4th St
- 378 Mullberry Place
- 1108 Poppy Ct
- Spectrum Plan at Metro Heights - Viewpoint
- 55 Remy Ln
- 15 Remy Ln
- Apex Plan at Metro Heights - Viewpoint
- 105 Remy Ln
- 25 Remy Ln
- 1198 Poppy Ct
- 228 Mullberry Place
- 217 Dochan Cir
- 348 E Lincoln Ave
- 653 N Raywood Ave
- 917 N Poplar Ave
- 101 W Los Amigos Ave
- 920 N Doner Dr
- 913 N Poplar Ave
- 916 N Doner Dr
- 924 N Doner Dr
- 200 Casa Grande Ave
- 912 N Doner Dr
- 909 N Poplar Ave
- 201 E Los Amigos Ave
- 204 Casa Grande Ave
- 908 N Doner Dr
- 201 Casa Grande Ave
- 205 E Los Amigos Ave
- 110 W Los Amigos Ave
- 102 W Los Amigos Ave
- 106 W Los Amigos Ave
- 114 W Los Amigos Ave
- 905 N Poplar Ave
- 904 N Doner Dr