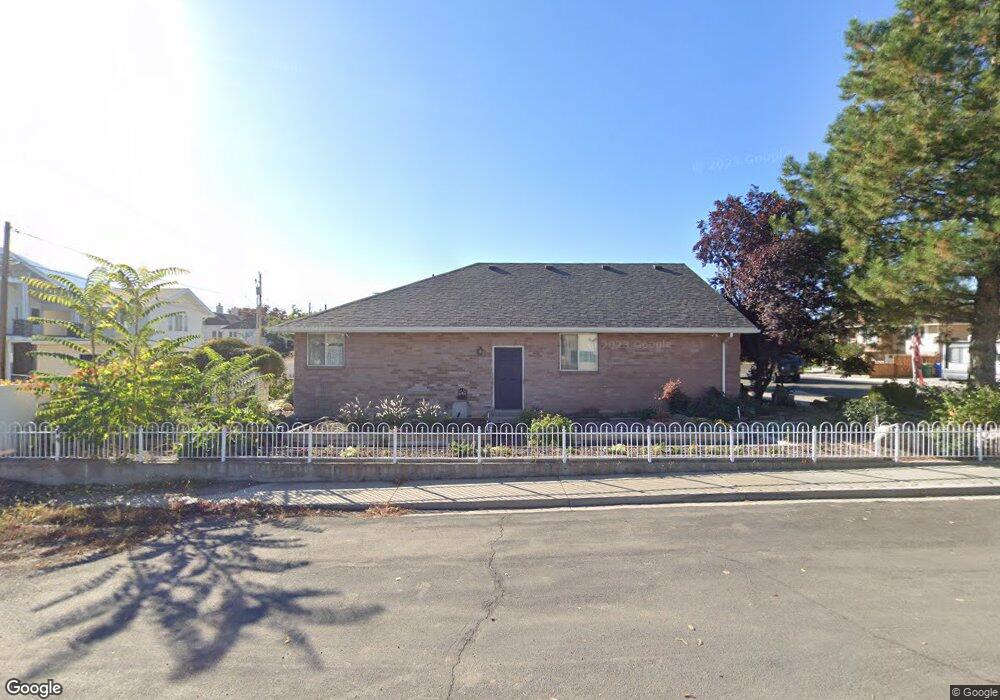
921 S 925 E Orem, UT 84097
Hillcrest NeighborhoodEstimated Value: $805,000 - $970,000
5
Beds
4
Baths
5,108
Sq Ft
$173/Sq Ft
Est. Value
About This Home
This home is located at 921 S 925 E, Orem, UT 84097 and is currently estimated at $881,597, approximately $172 per square foot. 921 S 925 E is a home located in Utah County with nearby schools including Centennial Elementary, Lakeridge Jr High School, and Orem High School.
Ownership History
Date
Name
Owned For
Owner Type
Purchase Details
Closed on
Oct 31, 2025
Sold by
Raynes David
Bought by
Raynes David and Raynes Sydney A
Current Estimated Value
Home Financials for this Owner
Home Financials are based on the most recent Mortgage that was taken out on this home.
Original Mortgage
$704,000
Outstanding Balance
$704,000
Interest Rate
5.88%
Mortgage Type
New Conventional
Estimated Equity
$177,597
Purchase Details
Closed on
Dec 28, 2023
Sold by
Kenneth A Clegg Revocable Trust
Bought by
Raynes David
Home Financials for this Owner
Home Financials are based on the most recent Mortgage that was taken out on this home.
Original Mortgage
$703,000
Interest Rate
7.44%
Mortgage Type
New Conventional
Purchase Details
Closed on
Jun 6, 2023
Sold by
Clegg Kenneth Arnold
Bought by
Kenneth A Clegg Revocable Trust
Create a Home Valuation Report for This Property
The Home Valuation Report is an in-depth analysis detailing your home's value as well as a comparison with similar homes in the area
Home Values in the Area
Average Home Value in this Area
Purchase History
| Date | Buyer | Sale Price | Title Company |
|---|---|---|---|
| Raynes David | -- | Trident Title | |
| Raynes David | -- | Us Title Insurance Agency | |
| Kenneth A Clegg Revocable Trust | -- | None Listed On Document |
Source: Public Records
Mortgage History
| Date | Status | Borrower | Loan Amount |
|---|---|---|---|
| Open | Raynes David | $704,000 | |
| Previous Owner | Raynes David | $703,000 |
Source: Public Records
Tax History
| Year | Tax Paid | Tax Assessment Tax Assessment Total Assessment is a certain percentage of the fair market value that is determined by local assessors to be the total taxable value of land and additions on the property. | Land | Improvement |
|---|---|---|---|---|
| 2025 | $3,613 | $455,950 | -- | -- |
| 2024 | $3,613 | $441,760 | $0 | $0 |
| 2023 | $3,462 | $455,015 | $0 | $0 |
| 2022 | $3,522 | $448,415 | $0 | $0 |
| 2021 | $3,111 | $599,900 | $174,800 | $425,100 |
| 2020 | $2,915 | $552,500 | $139,800 | $412,700 |
| 2019 | $2,588 | $510,000 | $139,800 | $370,200 |
| 2018 | $2,546 | $479,500 | $139,800 | $339,700 |
| 2017 | $2,573 | $259,600 | $0 | $0 |
| 2016 | $2,522 | $234,630 | $0 | $0 |
| 2015 | $2,667 | $234,630 | $0 | $0 |
| 2014 | $2,290 | $200,585 | $0 | $0 |
Source: Public Records
Map
Nearby Homes
- 745 S 900 E
- 930 E 700 S
- 721 S 670 E
- 404 W 3700 N
- 544 S Carterville Rd
- 943 S 550 E
- 638 E 600 S
- 478 S 950 E
- 1360 S Carterville Rd
- 158 Woodside Dr
- 946 S 450 E
- 543 S 560 E
- 350 S 900 E
- 415 S 650 E
- 3240 Shadowbrook Dr
- 560 S 500 E
- 111 Candlewood Place
- 3305 N Shadowbrook Cir
- 3221 Shadowbrook Cir
- 556 S 450 E
Your Personal Tour Guide
Ask me questions while you tour the home.