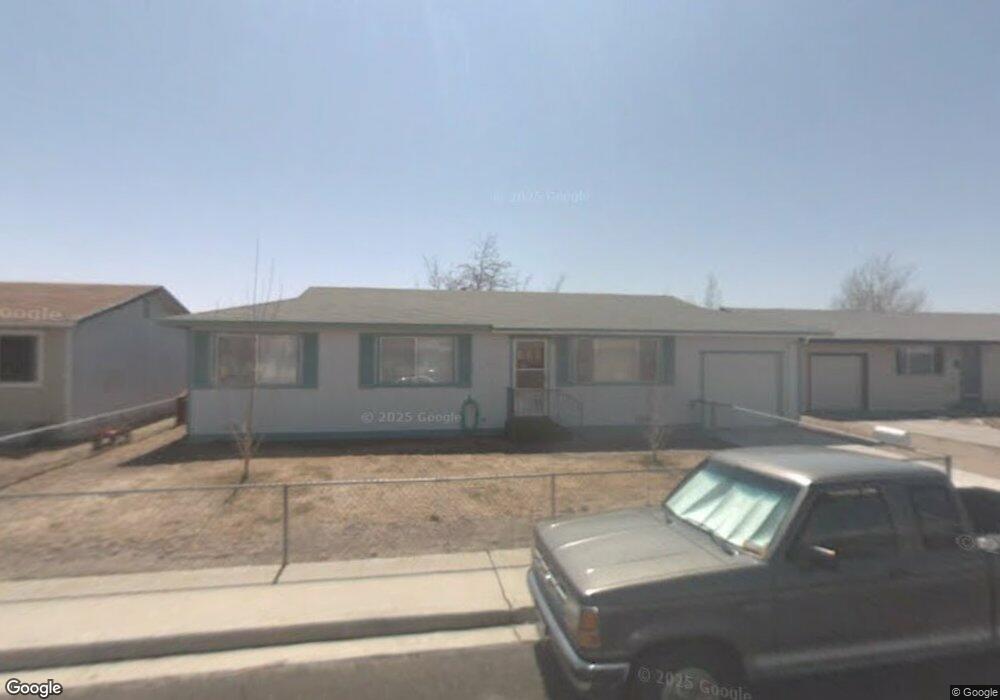
921 Saint Patrick Ct Unit 1A Fallon, NV 89406
Estimated Value: $254,000 - $277,000
3
Beds
2
Baths
1,008
Sq Ft
$261/Sq Ft
Est. Value
About This Home
This home is located at 921 Saint Patrick Ct Unit 1A, Fallon, NV 89406 and is currently estimated at $263,313, approximately $261 per square foot. 921 Saint Patrick Ct Unit 1A is a home located in Churchill County with nearby schools including Lahontan Elementary School, E.C. Best Elementary School, and Numa Elementary School.
Ownership History
Date
Name
Owned For
Owner Type
Purchase Details
Closed on
Feb 1, 2017
Sold by
Bettencourt Donna A
Bought by
Williams David
Current Estimated Value
Home Financials for this Owner
Home Financials are based on the most recent Mortgage that was taken out on this home.
Original Mortgage
$82,500
Outstanding Balance
$68,497
Interest Rate
4.3%
Mortgage Type
New Conventional
Estimated Equity
$194,816
Purchase Details
Closed on
Nov 25, 2013
Sold by
Bettencourt Donna A
Bought by
Bettencourt Donna A
Purchase Details
Closed on
Jun 22, 2011
Sold by
Bettencourt Donna A
Bought by
Bettencourt Donna A and Pierce Deborah S
Purchase Details
Closed on
Dec 7, 2010
Sold by
Karnopp Jack Leroy
Bought by
Karnopp Jack Leroy and Bettencourt Donna A
Create a Home Valuation Report for This Property
The Home Valuation Report is an in-depth analysis detailing your home's value as well as a comparison with similar homes in the area
Home Values in the Area
Average Home Value in this Area
Purchase History
| Date | Buyer | Sale Price | Title Company |
|---|---|---|---|
| Williams David | $82,500 | Western Nevada Title Company | |
| Bettencourt Donna A | -- | None Available | |
| Bettencourt Donna A | -- | None Available | |
| Karnopp Jack Leroy | $66,651 | None Available |
Source: Public Records
Mortgage History
| Date | Status | Borrower | Loan Amount |
|---|---|---|---|
| Open | Williams David | $82,500 |
Source: Public Records
Tax History
| Year | Tax Paid | Tax Assessment Tax Assessment Total Assessment is a certain percentage of the fair market value that is determined by local assessors to be the total taxable value of land and additions on the property. | Land | Improvement |
|---|---|---|---|---|
| 2025 | $724 | $27,167 | $13,650 | $13,517 |
| 2024 | $724 | $26,281 | $12,950 | $13,331 |
| 2023 | $724 | $25,126 | $12,250 | $12,876 |
| 2022 | $681 | $18,956 | $8,050 | $10,906 |
| 2021 | $661 | $17,845 | $8,050 | $9,795 |
| 2020 | $681 | $18,429 | $8,050 | $10,379 |
| 2019 | $684 | $18,523 | $8,050 | $10,473 |
| 2018 | $658 | $18,629 | $8,050 | $10,579 |
| 2017 | $638 | $17,379 | $6,475 | $10,904 |
| 2016 | $622 | $16,996 | $6,475 | $10,521 |
| 2015 | $610 | $16,051 | $6,475 | $9,576 |
| 2014 | $592 | $15,956 | $7,000 | $8,956 |
Source: Public Records
Map
Nearby Homes
- 861 W Center St
- 841 W Center St
- 521 Whitaker Ln
- 65 S Bailey St
- 250 S Taylor St
- 360 & 360 1/2 W Virginia St
- 1009 Deena Way
- 345 Lincoln St
- 12017 Power Line Rd
- 1.55 Acres on S Maine St
- 1291 S Taylor St
- 009-291-74 00929174
- 1044 Allen Rd
- 1091 Tiffany Dr
- 635 Churchill St
- 521 Meadow Glen Dr
- 530 Michael Dr
- 540 Michael Dr
- 628 Humboldt St
- 1049 Tamarack Ct
- 941 St Patrick Ct
- 911 St Patrick Ct
- 911 Saint Patrick Ct Unit 1A
- 941 Saint Patrick Ct
- 920 Joyce Ct
- 961 Saint Patrick Ct
- 940 Joyce Ct
- 901 Saint Patrick Ct
- 910 Joyce Ct
- 920 Saint Patrick Ct
- 910 St Patricks
- 910 Saint Patrick Ct
- 940 Saint Patrick Ct
- 960 Joyce Ct
- 900 Joyce Ct
- 911 St Patricks
- 981 St Patricks Ct
- 981 Saint Patrick Ct
- 900 Saint Patrick Ct
- 960 St Patrick Ct
Your Personal Tour Guide
Ask me questions while you tour the home.