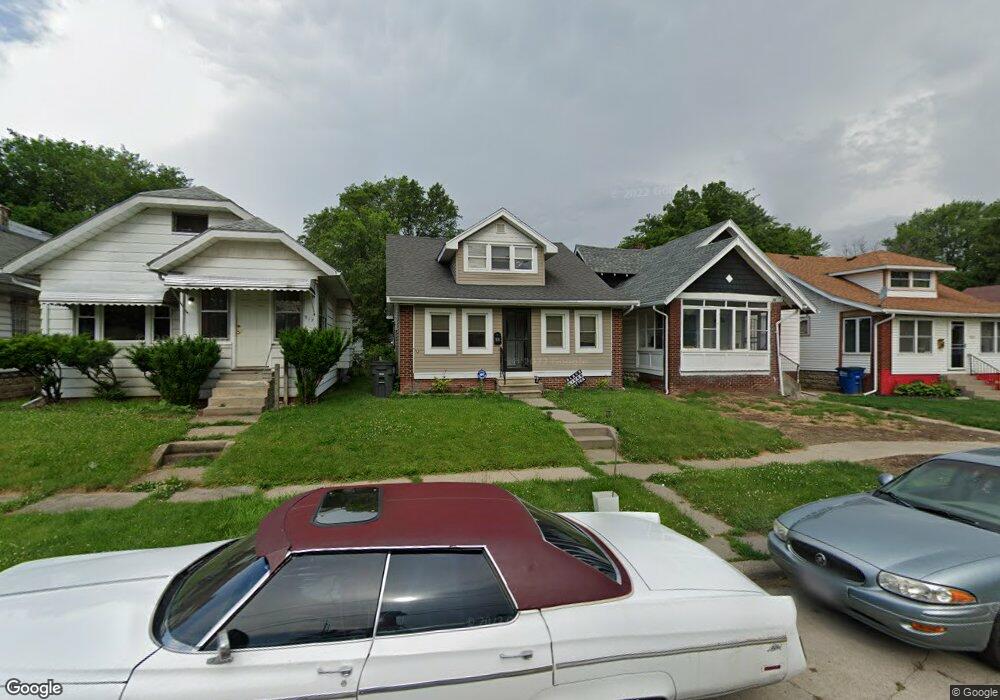
921 Shirley Ave Toledo, OH 43607
Scott Park NeighborhoodEstimated Value: $72,000 - $98,000
3
Beds
2
Baths
1,224
Sq Ft
$71/Sq Ft
Est. Value
About This Home
This home is located at 921 Shirley Ave, Toledo, OH 43607 and is currently estimated at $86,873, approximately $70 per square foot. 921 Shirley Ave is a home located in Lucas County with nearby schools including Jesup W. Scott High School, Explorers Academy, and Explorers Academy of Science and Technology.
Ownership History
Date
Name
Owned For
Owner Type
Purchase Details
Closed on
Aug 16, 2010
Sold by
Striegler Rory
Bought by
Dicenso Emily L
Current Estimated Value
Home Financials for this Owner
Home Financials are based on the most recent Mortgage that was taken out on this home.
Original Mortgage
$40,634
Outstanding Balance
$28,135
Interest Rate
5.5%
Mortgage Type
FHA
Estimated Equity
$58,738
Purchase Details
Closed on
Jan 15, 2009
Sold by
Invest Smart Homes Llc
Bought by
Striegler Rory
Purchase Details
Closed on
Jan 8, 2009
Sold by
Federal Home Loan Mortgage Corporation
Bought by
Invest Smart Homes Llc
Purchase Details
Closed on
Jul 3, 2008
Sold by
Ledyard James A
Bought by
Federal Home Loan Mortgage Corp
Purchase Details
Closed on
Mar 29, 2002
Sold by
Matthew Makins
Bought by
Ledyard James A
Home Financials for this Owner
Home Financials are based on the most recent Mortgage that was taken out on this home.
Original Mortgage
$33,750
Interest Rate
6.93%
Purchase Details
Closed on
Aug 8, 1990
Sold by
Webb Thomas Harlow and Webb Kim
Create a Home Valuation Report for This Property
The Home Valuation Report is an in-depth analysis detailing your home's value as well as a comparison with similar homes in the area
Home Values in the Area
Average Home Value in this Area
Purchase History
| Date | Buyer | Sale Price | Title Company |
|---|---|---|---|
| Dicenso Emily L | $41,700 | Chicago Title Insurance Co | |
| Striegler Rory | $6,900 | Attorney | |
| Invest Smart Homes Llc | $4,500 | Attorney | |
| Federal Home Loan Mortgage Corp | $26,000 | None Available | |
| Ledyard James A | $37,500 | Midland | |
| -- | $26,000 | -- |
Source: Public Records
Mortgage History
| Date | Status | Borrower | Loan Amount |
|---|---|---|---|
| Open | Dicenso Emily L | $40,634 | |
| Previous Owner | Ledyard James A | $33,750 |
Source: Public Records
Tax History Compared to Growth
Tax History
| Year | Tax Paid | Tax Assessment Tax Assessment Total Assessment is a certain percentage of the fair market value that is determined by local assessors to be the total taxable value of land and additions on the property. | Land | Improvement |
|---|---|---|---|---|
| 2024 | $574 | $17,115 | $5,110 | $12,005 |
| 2023 | $1,198 | $17,255 | $4,165 | $13,090 |
| 2022 | $1,197 | $17,255 | $4,165 | $13,090 |
| 2021 | $1,177 | $17,255 | $4,165 | $13,090 |
| 2020 | $1,131 | $14,385 | $3,430 | $10,955 |
| 2019 | $1,095 | $14,385 | $3,430 | $10,955 |
| 2018 | $1,089 | $14,385 | $3,430 | $10,955 |
| 2017 | $1,142 | $14,070 | $3,360 | $10,710 |
| 2016 | $1,118 | $40,200 | $9,600 | $30,600 |
| 2015 | $1,083 | $40,200 | $9,600 | $30,600 |
| 2014 | $885 | $14,070 | $3,360 | $10,710 |
| 2013 | $885 | $14,070 | $3,360 | $10,710 |
Source: Public Records
Map
Nearby Homes
- 908 Coventry Ave
- 913 Coventry Ave
- 2307 Avondale Ave
- 2145 Dorr St
- 1215 Woodstock Ave
- 1329 Parkside Blvd
- 1318 Addington Rd
- 2033 Crosswell Place
- 1131 Montrose Ave
- 605 Waverly Ave
- 1940 Crosswell Place
- 1513 Waverly Ave
- 1423 Roosevelt Ave
- 1420 Upton Ave
- 2000 Oakwood Ave
- 1723 Potomac Dr
- 1735 Perth St
- 1929 Foster Ave
- 1819 Oakwood Ave
- 1771 Kensington Rd
- 917 Shirley Ave
- 913 Shirley Ave
- 923 Shirley Ave
- 911 Shirley Ave
- 905 Shirley Ave
- 907 Shirley Ave
- 925 Shirley Ave
- 912 Coventry Ave
- 910 Coventry Ave
- 901 Shirley Ave
- 916 Coventry Ave
- 931 Shirley Ave
- 914 Coventry Ave
- 906 Coventry Ave
- 915 Parkside Blvd
- 920 Coventry Ave
- 919 Parkside Blvd
- 911 Parkside Blvd
- 918 Coventry Ave
- 923 Parkside Blvd