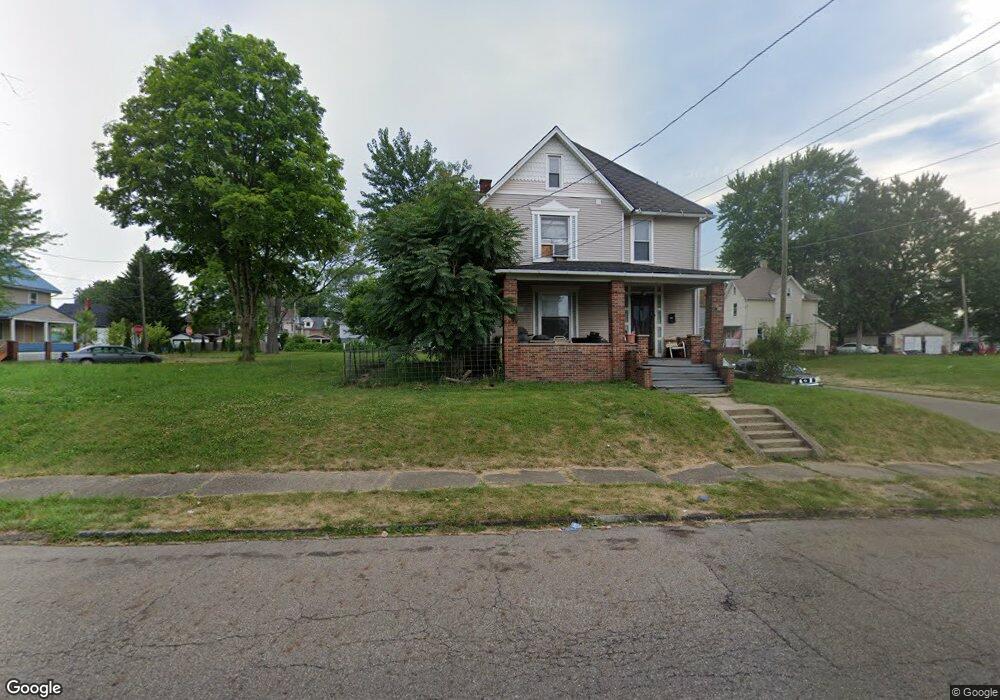
921 Shorb Ave NW Canton, OH 44703
Summit NeighborhoodEstimated Value: $59,000 - $96,000
3
Beds
2
Baths
1,868
Sq Ft
$37/Sq Ft
Est. Value
About This Home
This home is located at 921 Shorb Ave NW, Canton, OH 44703 and is currently estimated at $69,868, approximately $37 per square foot. 921 Shorb Ave NW is a home located in Stark County with nearby schools including Early Learning Center @ Schreiber, Gibbs Elementary School, and Clarendon Intermediate School.
Ownership History
Date
Name
Owned For
Owner Type
Purchase Details
Closed on
Oct 28, 2025
Sold by
City Of Canton
Bought by
Stark County Port Authority
Current Estimated Value
Purchase Details
Closed on
Oct 16, 2025
Sold by
Stark County Port Authority
Bought by
Canton For All People Acquisition & Holding C
Purchase Details
Closed on
Jun 3, 2024
Sold by
Stark Cnty Land Reutilization
Bought by
City Of Canton
Purchase Details
Closed on
Mar 14, 2019
Sold by
Stark County Land Reutilization Corp
Bought by
Stark Cnty Regional Planning Commission
Purchase Details
Closed on
Jan 31, 2019
Sold by
Compher Christopher
Bought by
Stark County Land Reutilization Corp
Purchase Details
Closed on
Feb 27, 2014
Sold by
Kramer Deborah E
Bought by
Compher Christopher and Casey Rachelle
Purchase Details
Closed on
Oct 22, 2008
Sold by
Kramer Thomas R
Bought by
Kramer Deborah E
Purchase Details
Closed on
Dec 21, 1992
Create a Home Valuation Report for This Property
The Home Valuation Report is an in-depth analysis detailing your home's value as well as a comparison with similar homes in the area
Home Values in the Area
Average Home Value in this Area
Purchase History
| Date | Buyer | Sale Price | Title Company |
|---|---|---|---|
| Stark County Port Authority | -- | None Listed On Document | |
| Canton For All People Acquisition & Holding C | -- | None Listed On Document | |
| City Of Canton | -- | None Listed On Document | |
| Stark Cnty Regional Planning Commission | -- | None Available | |
| Stark County Land Reutilization Corp | -- | None Available | |
| Compher Christopher | $500 | None Available | |
| Kramer Deborah E | -- | Patriot Title Agency Inc | |
| -- | $30,000 | -- |
Source: Public Records
Tax History Compared to Growth
Tax History
| Year | Tax Paid | Tax Assessment Tax Assessment Total Assessment is a certain percentage of the fair market value that is determined by local assessors to be the total taxable value of land and additions on the property. | Land | Improvement |
|---|---|---|---|---|
| 2025 | -- | $1,750 | $1,750 | -- |
| 2024 | -- | $1,960 | $1,960 | -- |
| 2023 | $0 | $1,020 | $1,020 | $0 |
| 2022 | $346 | $6,940 | $2,000 | $4,940 |
| 2021 | $346 | $6,940 | $2,000 | $4,940 |
| 2020 | $287 | $7,560 | $2,030 | $5,530 |
| 2019 | $441 | $7,570 | $2,030 | $5,540 |
| 2018 | $568 | $7,570 | $2,030 | $5,540 |
| 2017 | $2,313 | $8,300 | $2,240 | $6,060 |
| 2016 | $2,303 | $8,050 | $2,240 | $5,810 |
| 2015 | $548 | $8,050 | $2,240 | $5,810 |
| 2014 | $679 | $9,700 | $2,700 | $7,000 |
| 2013 | $329 | $9,700 | $2,700 | $7,000 |
Source: Public Records
Map
Nearby Homes
- 811 Troy Place NW
- 806 Troy Place NW
- 905 High Ave NW
- 824 12th St NW
- 722 High Ave NW
- 1023 Fulton Rd NW
- 1005 Dewalt Ave NW
- 916 6th St NW
- 1221 9th St NW
- 1007 Dewalt Ave NW
- 1227 Worley Ave NW
- 1231 Worley Ave NW
- 1306 12th St NW
- 1015 4th St NW
- 413 Newton Ave NW
- 1224 Cleveland Ave NW
- 1405 8th St NW
- 1409 8th St NW
- 1024 3rd St NW
- 1347 Shorb Ave NW
- 915 Shorb Ave NW
- 925 Shorb Ave NW
- 910 Troy Place NW
- 916 Troy Place NW
- 910 Herbert Place NW
- 918 Troy Place NW
- 912 Herbert Place NW
- 907 Shorb Ave NW
- 924 Shorb Ave NW
- 920 Troy Place NW
- 918 Shorb Ave NW
- 910 Shorb Ave NW
- 901 Shorb Ave NW
- 915 9th St NW
- 915 Troy Place NW
- 930 Shorb Ave NW
- 919 Troy Place NW
- 926 Troy Place NW
- 830 Troy Place NW
- 939 Shorb Ave NW